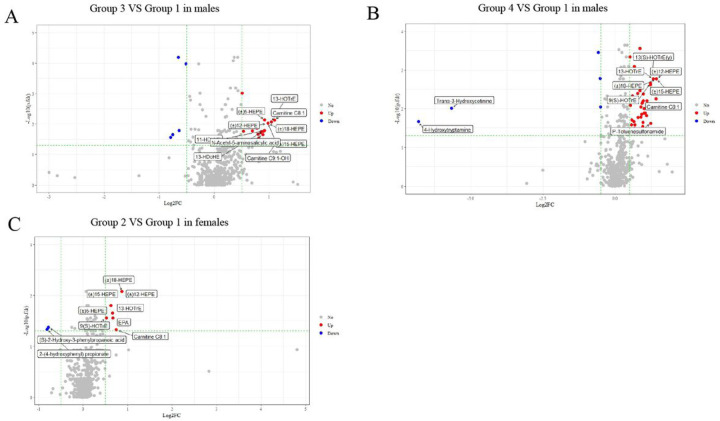
Figure 4. Volcanic map of differential metabolites (P<0.05, |log2(FC)>0.5 considered to be differential).
Differential metabolites were found between the normal group (group 1) and BMI&WC overweight increasing trajectory (group 3) in male (A), BMI&WC obesity increasing trajectory (group 4) in male (B) and BMI&WC normal increasing trajectory (group 2) in female (C). Blue was the down-regulated differential metabolite, red was the up-regulated differential metabolite, and metabolites with no difference were marked as grey. The P value was further adjusted for multiple testing of pairwise comparison using the Benjamini-Hochberg method. Figure A and Figure B showed only the top 10 metabolites with significant differences respectively, and the top 10 metabolites were sorted according to the absolute value of log2FC.

