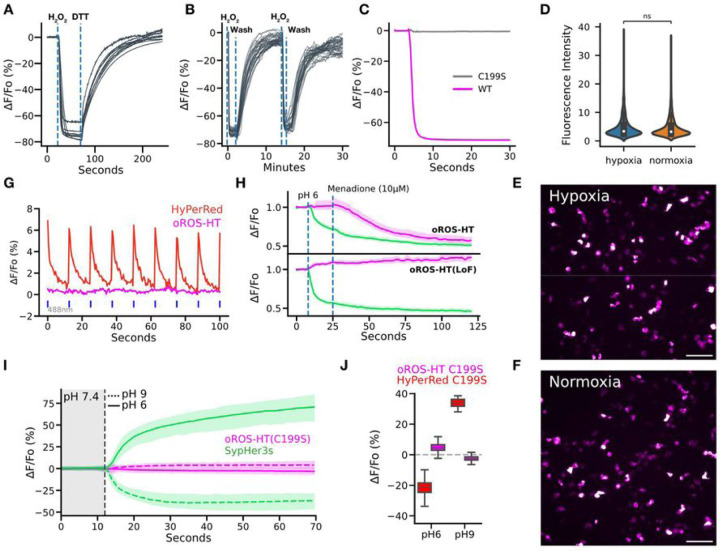
Figure 3.
Optimized biophysical properties and versatility of oROS-HT635 under varying external conditions.
A-B Reversibility of oROS-HT A. HEK293 expressing oROS-HT635 was first stimulated with 100μM H2O2 and then 10 μM Dithiothreitol (DTT), a reducing agent, shortly after. B. HEK293 expressing oROS-HT were stimulated with 100μM H2O2 followed by media wash and 2nd stimulation. (n=32, cells) C. Fluorescence change of oROS-HT635 is H2O2 specific. Fluorescence response of oROS-HT635-WT and oROS-HT635-C199S expressed in HEK293 to 300μM H2O2. C199S mutation disables OxyR’s H2O2 specific C199-C208 disulfide bonding mechanism. oROS-HT635-C1998 can be utilized as a negative control sensor. D-F Maturation of oROS-HT(C199S) in a hypoxic condition. HEK293 expressing Loss-of-function oROS-HT(C199S) were incubated for 18 hours in either Normoxia (atmospheric condition at 37°C) or Hypoxia (N2 infused chamber at 37°C) overnight (18h). D. Fluorescence intensity profile of oROS-HT(C199S) (Hypoxia [n = 1246] / Normoxia [n=1765] collected from 8/11 biological replicates, respectively). E., F. Representative images oROS-HT(C199S) maturated in HEK293 cells in Hypoxia or Normoxia conditions. Scale bar = 100μm. G. Representative fluorescence emission of oROS-HT and HyPerRed under their respective excitation wavelength (635nm and 597nm) and in response to 488nm light pulses. H. Dual monitoring of pH and H2O2 in mammalian cells. Either oROS-HT or oROS-HT(C199S) were paired with SypHer3s, a green fluorescence pH indicator, to be co-transfected on HEK 293 cells to monitor the sequential events of 1. pH environment change (pH6) and 2. Menadione (10μM) induced H2O2 increase. (n>100 per condition). I. Multiplexed epifluorescence imaging of Loss-of-function oROS-HT(C199S) and SypHer3s coexpressed in HEK293 cells. Neutral imaging solution (PBS, pH 7.44) was switched to either acidic (PBS, pH6) or basic (PBS, pH9) imaging solution at the vertical dashed line (gray). J. ΔF/Fo (%) of oROS-HT(C199S, from Fig. 3I) and HyPerRed(C199S) at pH9 or pH6. Left and right box plots for each condition represent values at the first and last frames, respectively. Descriptive Statistics: Error bars and bands represent the bootstrap confidence interval (95%) of the central tendency of values using the Seaborn (0.11.2) statistical plotting package. F: Error bands represent the 95% interval, ranging from the 2.5 to the 97.5 percentiles from medians using the Seaborn (0.12.1) statistical plotting package. Cell of interest collected from 3 biological replicates. SypHer3s pH9: 59.56 % ΔF/Fo (n > 100); ci = [58.46, 60.62]. SypHer3s pH6: −34.56 % ΔF/Fo (n >100); ci = [−35.15, −33.96]. oROS-HT(C199S) pH9: −2.43 (n >100); ci = [−2.54, −2.32]. oROS-HT(C199S) pH6: 4.9 (n > 100); ci = [4.64, 5.19]. Inferential Statistics: D.: t-test independent samples. *P < 0.05, **P < 0.01, ***P < 0.001.

