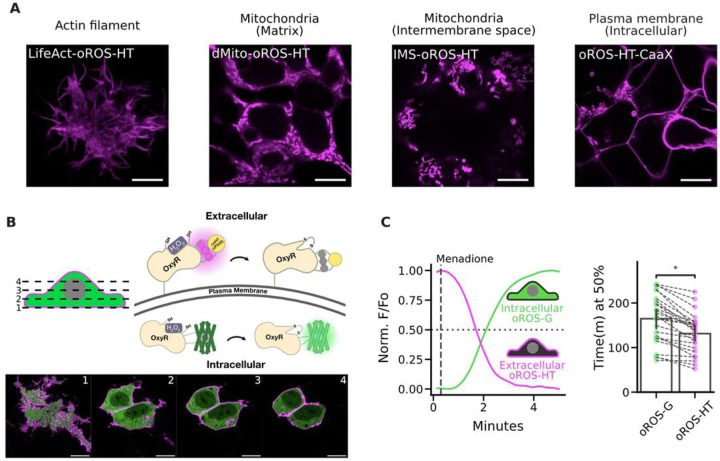
Figure 5.
Multi-parametric, dual-color imaging of intracellular and extracellular peroxide dynamics.
A. Subcellular localization of oROS-HT635 was achieved by previously reported trafficking sequences for actin (LifeAct), mitochondrial matrix (dMito), mitochondrial intermembrane space (IMS), and intracellular side of the plasma membrane (CaaX). HEK 293 cells expressing each trafficking variant were live-imaged using a Leica SP8 confocal microscope. Scale bar: 10μM. B. Confocal z-stack images of HEK293 cells co-expressing pDisplay-oROS-HT (extracellular side of the plasma membrane) and pC1-oROS-G (intracellular). Scale bar: 10μM. C. Fluorescence change of HEK 293 expressing pDisplayo-ROS-HT635 and pC1-oROS-G in response to 25 μM Menadione imaged with epifluorescence microscope. Both sensors were imaged every second. Left A representative trace of oROS-HT and oROS-G from a single cell. Right time (in minutes) at 50% sensor activation (n=25 cells from 4 biological replicates). Inferential Statistics: t-test independent samples. *P < 0.05, **P < 0.01, ***P < 0.001. ****P < 0.0001.

