
Figure 4.
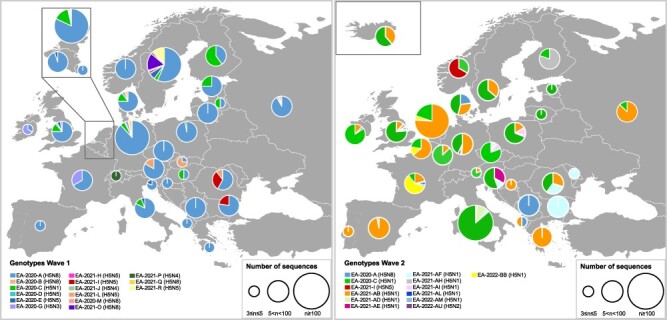
Geographic distribution of the major A(H5Nx) genotypes (represented by at least three viruses) in Europe during the first (2020–2021, left panel) and second (2021–2022, right panel) epidemic wave. The pie charts display the frequency of the genotype in each country. The size of the circle is proportional to the number of sequences analysed.