Figure 5.

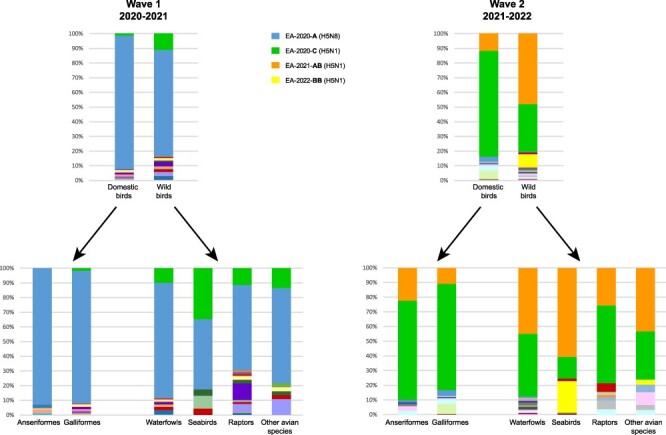
Distribution of the different genotypes by bird host categories during the first (2020–2021, left panel) and second (2021–2022, right panel) epidemic wave. The colours assigned to the four major genotypes are reported in the figure legend.

Distribution of the different genotypes by bird host categories during the first (2020–2021, left panel) and second (2021–2022, right panel) epidemic wave. The colours assigned to the four major genotypes are reported in the figure legend.