
Figure 7.
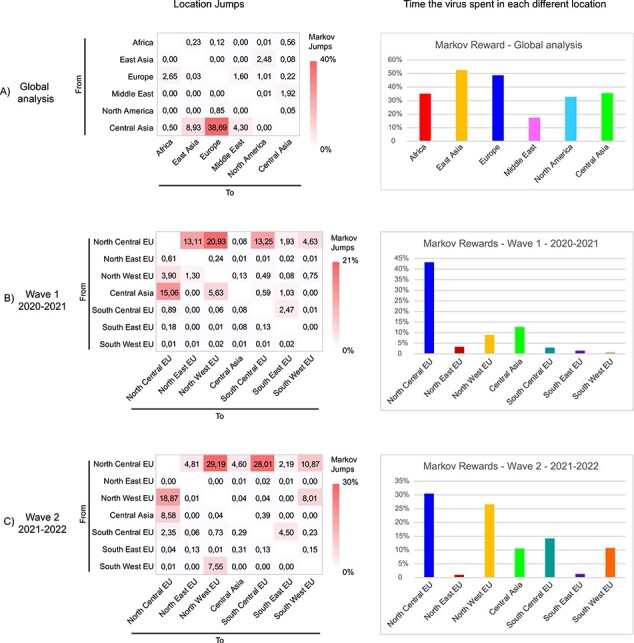
Pattern of geographic jumps and hotspots obtained from the analyses of (A) global dataset, (B) European dataset—first wave (2020–2021), and (C) European dataset—second wave (2021–2022). The three heatmaps on the left indicate the frequency of transitions between locations estimated using a discrete trait phylogenetic model. The number of location transitions was determined using Markov jumps. The bar charts on the right indicate the proportion of time the virus spent in each location.