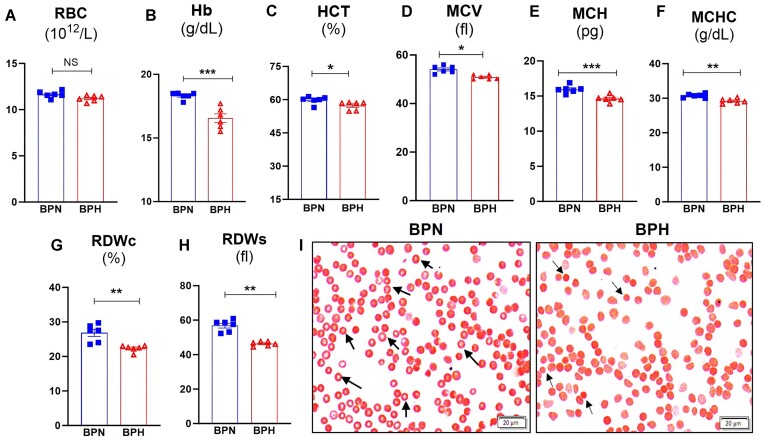
Figure 1.
Hypertensive mice exhibited microcytic anemia. Blood from BPN and BPH mice (8-wk-old males, n = 6) was collected (EDTA tubes) for complete blood count (CBC; via VetScan hematology analyzer). Results for (A) Erythrocytes, red blood cells (RBC), (B) Hemoglobin (Hb), (C) Hematocrit (HCT, % RBC), (D) Mean corpuscular volume (MCV, average size of RBC), (E) Mean corpuscular hemoglobin (MCH average amount of hemoglobin in RBC), (F) Mean corpuscular hemoglobin concentration (MCHC, average concentration of hemoglobin in a given volume of RBC) via CBC. RBC distribution width (RDW, variation of the size/volume), (G) RDWc (RDW coefficient of variation), and (H) RDWs (RDW standard deviation), and (I) Giemsa staining of RBC from BPN and BPH mice. Data represented as mean ± SEM from three independent experiments. *P < .05, **P < .01, and ***P < .001.

