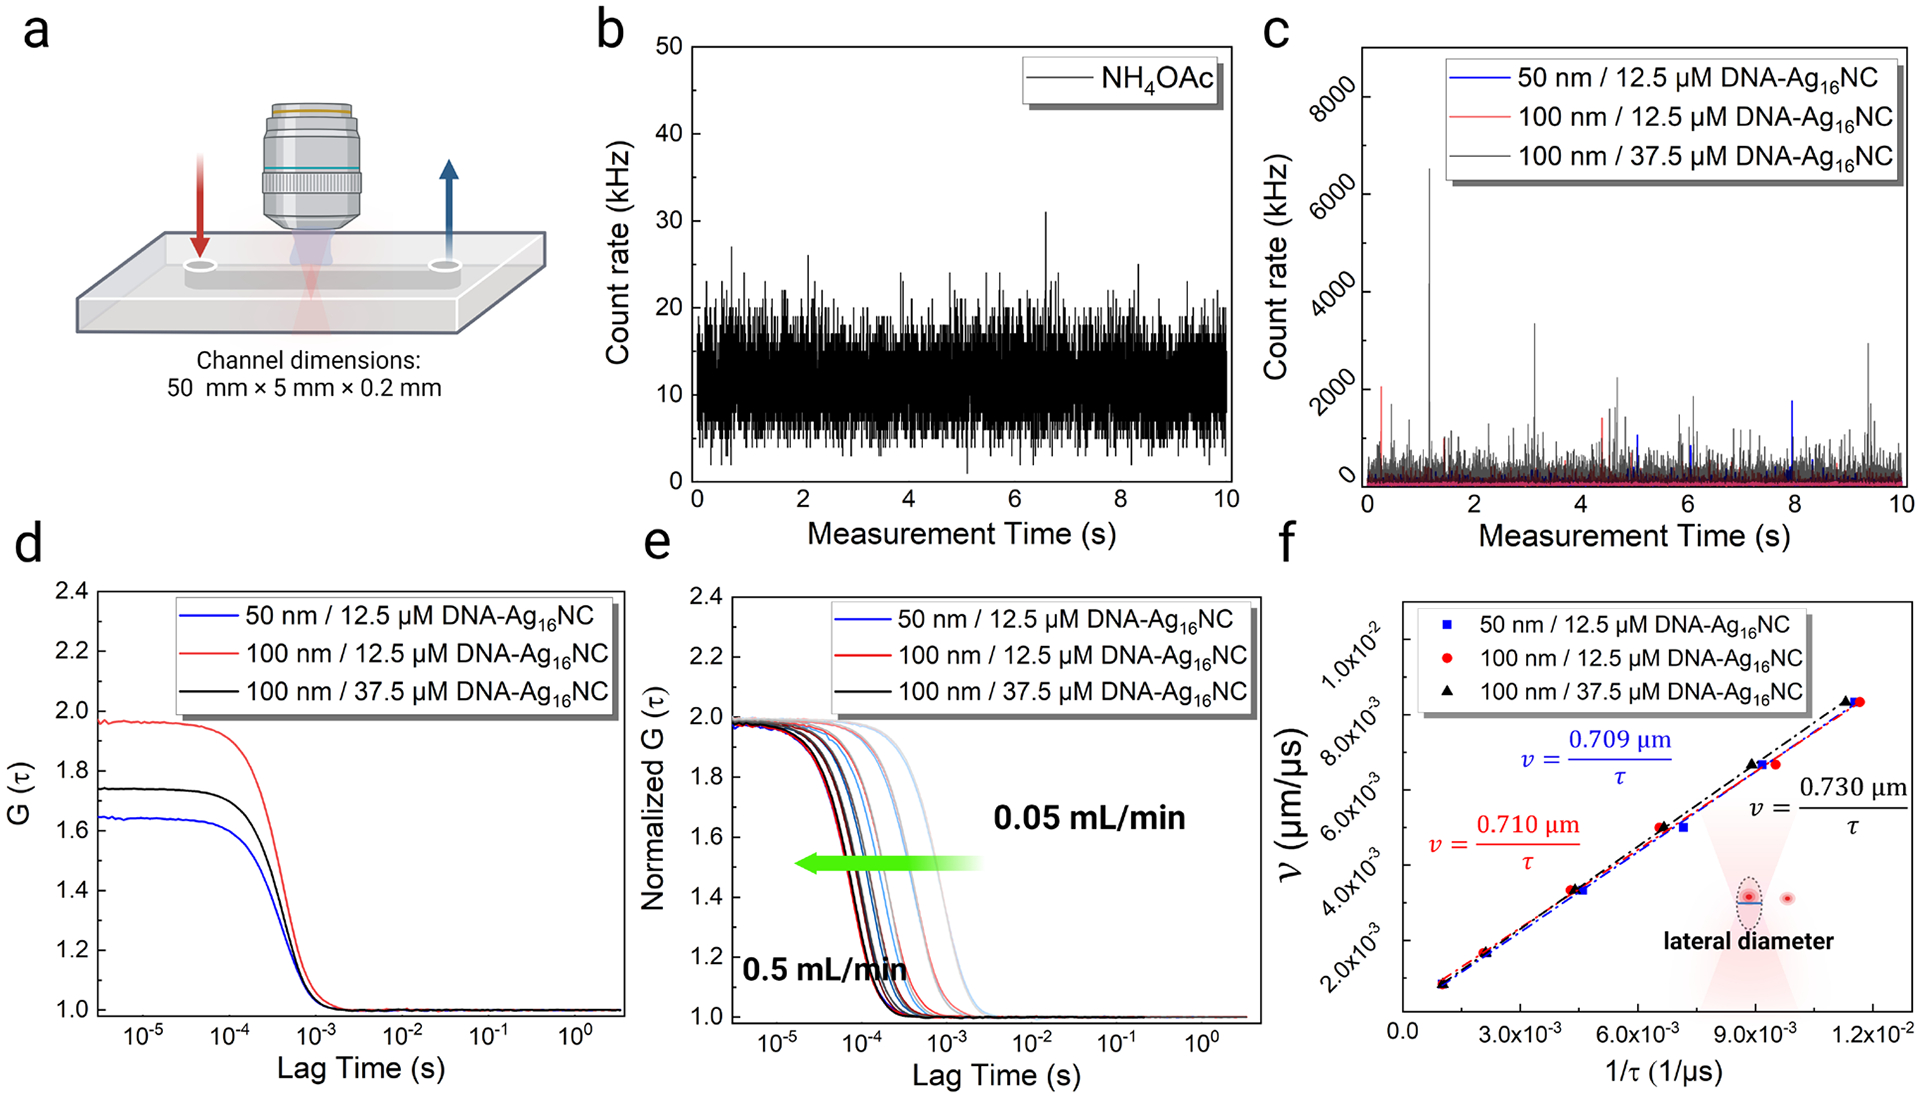
Figure 3.

Characterization of the liposomes loaded with DNA-Ag16NCs in the microfluidic flow chamber. (a) Schematic showing the flow chamber dimensions and flow direction. Emission intensity fluctuations of (b) 10 mM NH4OAc and (c) liposomes loaded with DNA-Ag16NCs in the flow chamber under 1045 nm excitation and 0.1 mL/min flow rate. Note that only a 10 s section of a 100 s long time trace is shown here. (d) The corresponding autocorrelation functions of liposomes loaded with DNA-Ag16NCs. (e) Normalized autocorrelation functions of the DNA-Ag16NC-loaded liposomes under different flow rates (0.05 mL/min to 0.5 mL/min from right to left, as the green arrow shows). (f) The proportional fitting curves of the liposome flow velocity as a function of 1/residence time.
