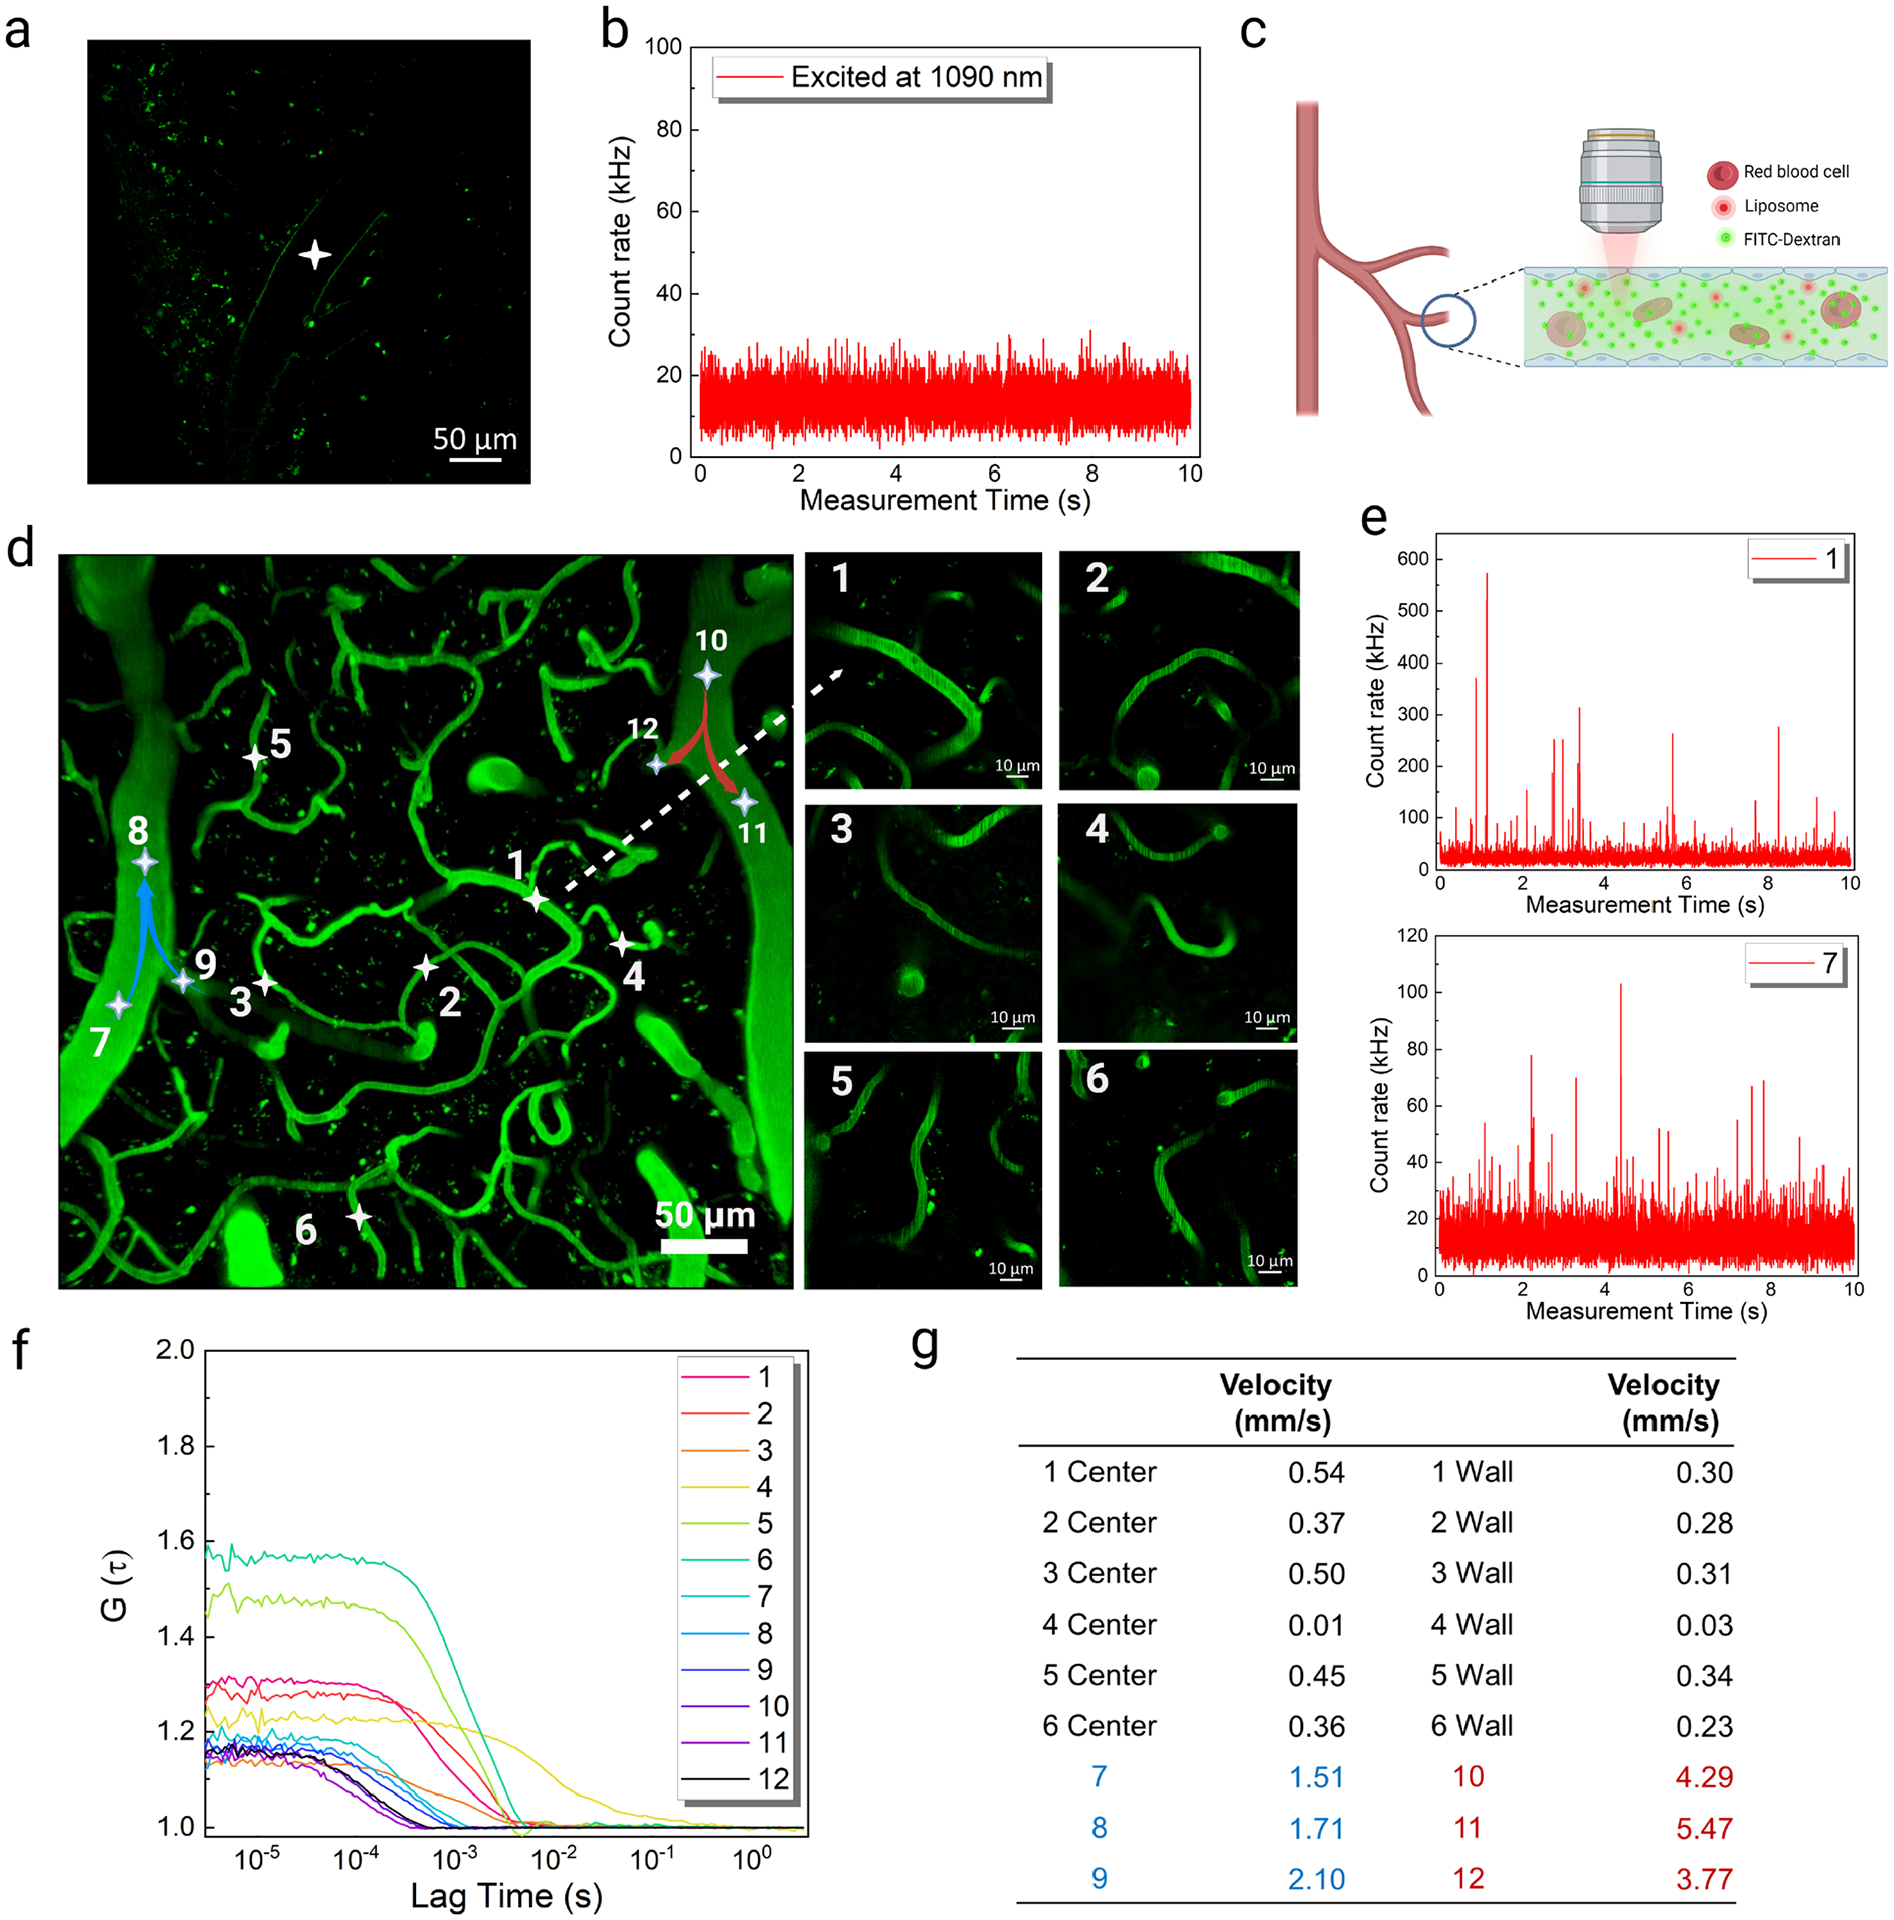
Figure 5.

In vivo monitoring of liposomes loaded with DNA-Ag16NCs and cerebrovascular blood flow velocity measurements. (a) Cerebral vascular image obtained in the green channel under 920 nm (25 mW) excitation in a mouse with nothing injected; the white asterisk indicates the FCS position. (b) Emission intensity fluctuations in the red/NIR I channel under 1090 nm (12 mW) excitation with nothing injected. (c) Schematic showing the cerebrovascular blood flow after FITC-Dextran and DNA-Ag16NC-loaded liposome injection. (d) In vivo images of the mouse cerebral vasculature after FITC-Dextran and DNA-Ag16NC-loaded liposome delivery. Left: maximum intensity projection of the 3D image with 35 μm thickness. Right: enlarged capillary images. (e) Emission intensity fluctuations at the center of positions 1 and 7 under 1090 nm excitation. (f) The corresponding autocorrelation functions at the positions under 1090 nm excitation. For positions 1–6, the autocorrelation functions at the center were represented. (g) Measured blood flow velocities at the center and wall of the cerebrovascular. Data from arterioles locations were highlighted in red and venules in blue.
