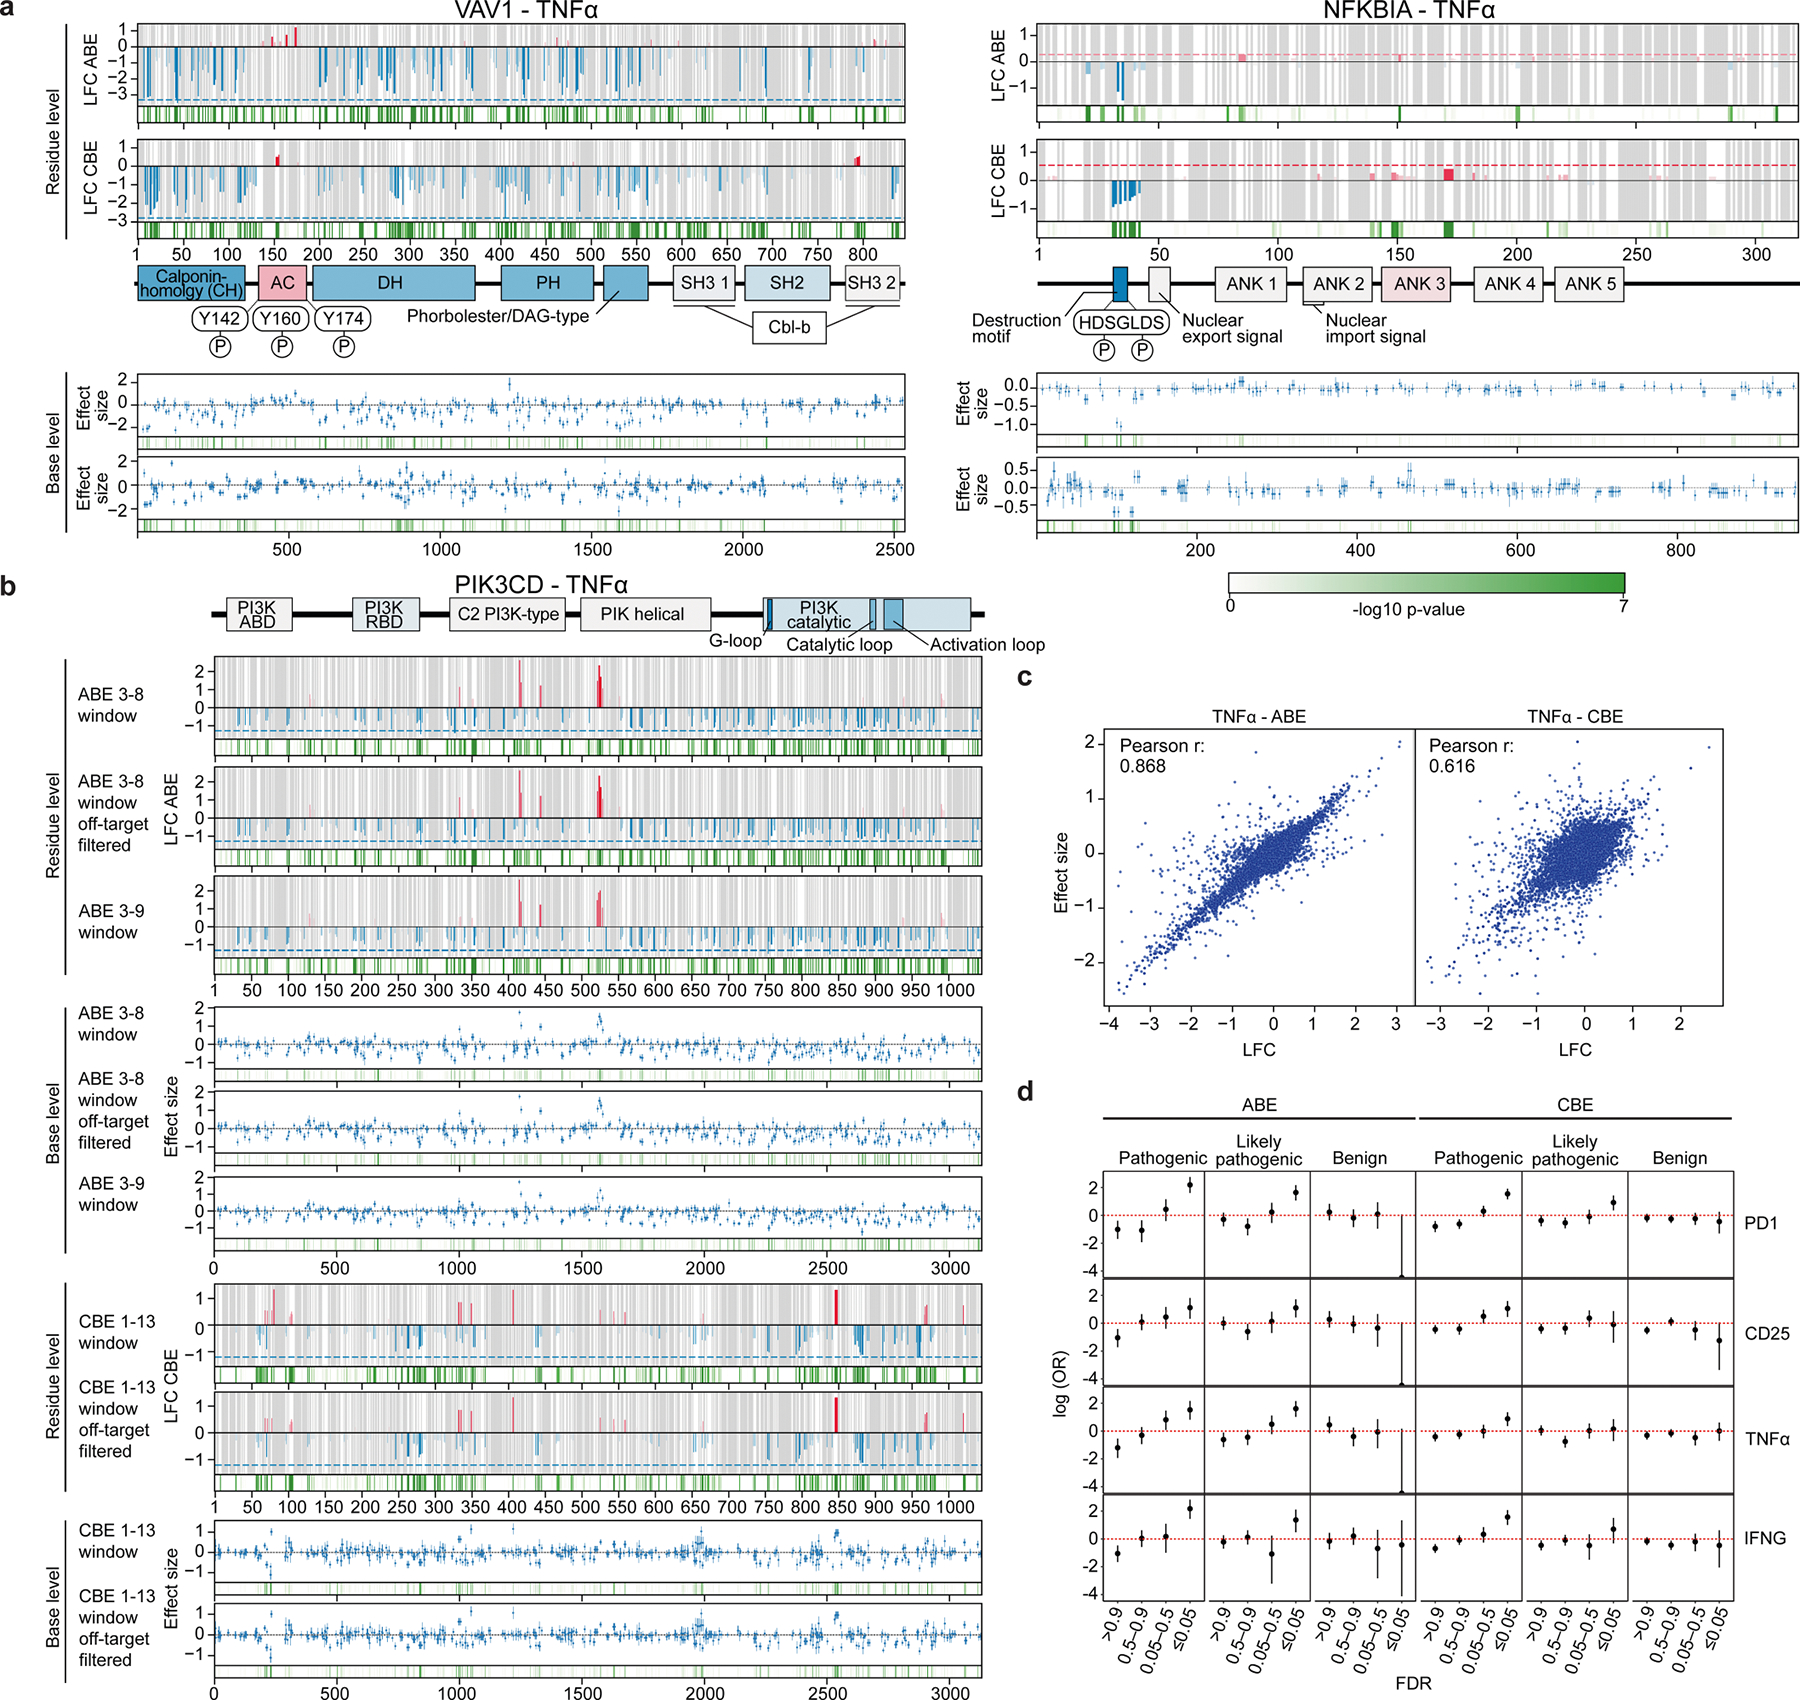
Extended Data Fig. 5 |. Comparative analysis of residue vs. base-level analysis and correlation to clinical variants.

a, Comparison between residue-level analysis derived from average LFC (log2-fold change) and base-level analysis derived from a multiple regression model for VAV1 and NFKBIA. For residue-level: p values were derived with Fisher’s method from MAGeCK results for individual guides; for base-level: p values were derived from a two-sided Wald test. b, Residue-level and base-level analysis for PIK3CD showing comparisons when guides with high off-target scores are filtered from analysis as well as when the predicted editing window for ABE is expanded to include the 9th position. c, Effect size for base-level analysis vs. LFC (log2-fold change) for residue-level analysis is plotted for the TNFα ABE (left) and CBE (right) screens. d, Variants are binned based on MAGeCK guide-level FDR. Enrichments of base edited variants in Clinvar “pathogenic,” “likely pathogenic,” and “benign” categories are plotted for each group for the PD1, CD25, TNFα, and IFNγ screens (from n = 3 donors); error bars represent 95% confidence intervals.
