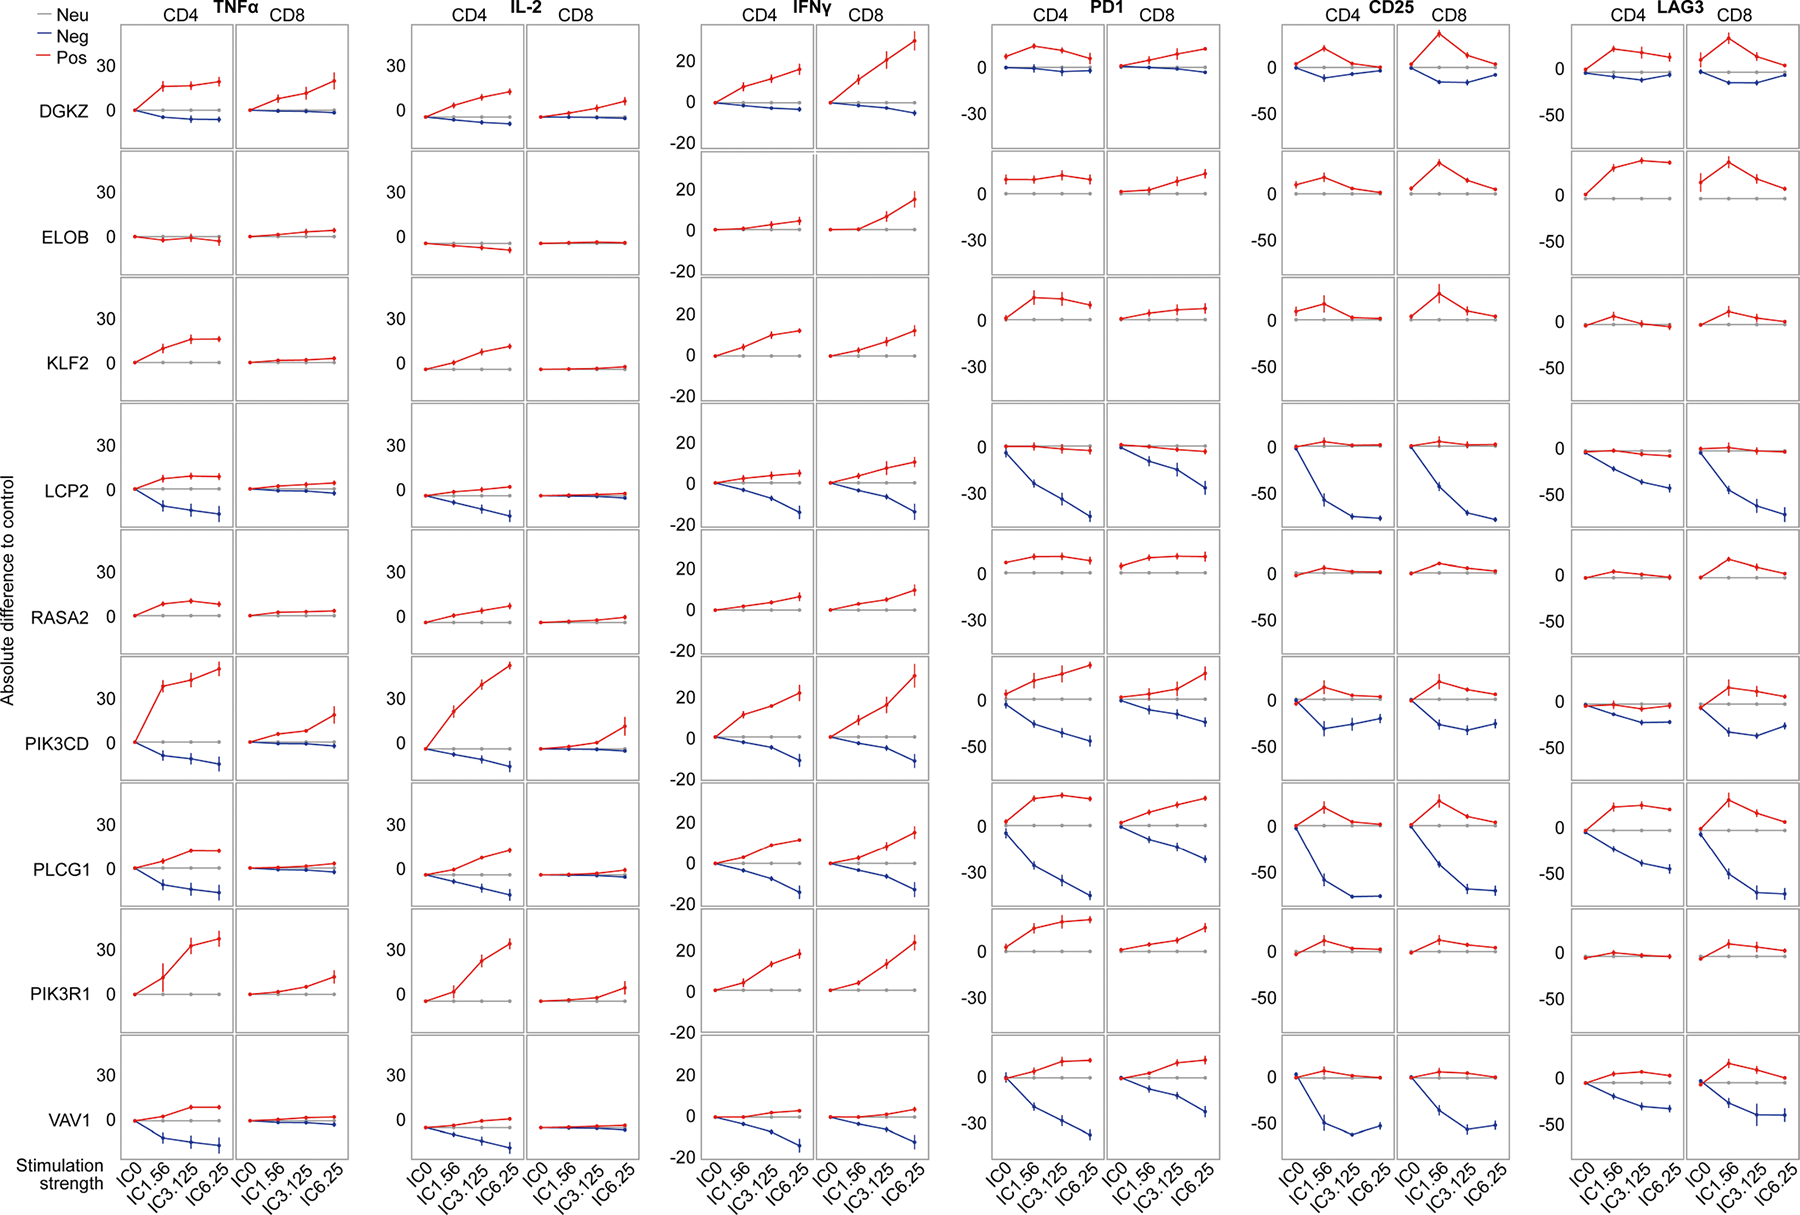
Extended Data Fig. 7 |. Stimulation responses of base edited T cells in arrayed validation.

Individual plots of cytokine and cell surface protein expression for CD4+ or CD8+ T cells base edited with the indicated guides (red, positive in TNFα screen; blue, negative in TNFα screen; gray, AAVS1 control), measured by flow cytometry and normalized to AAVS1 control, over a range of anti-CD3/28/2 immunocult (IC) doses ranging from 0 (IC0) to 6.25ul/ml (IC6.25). n = 6 human donors, shown as mean ± SE.
