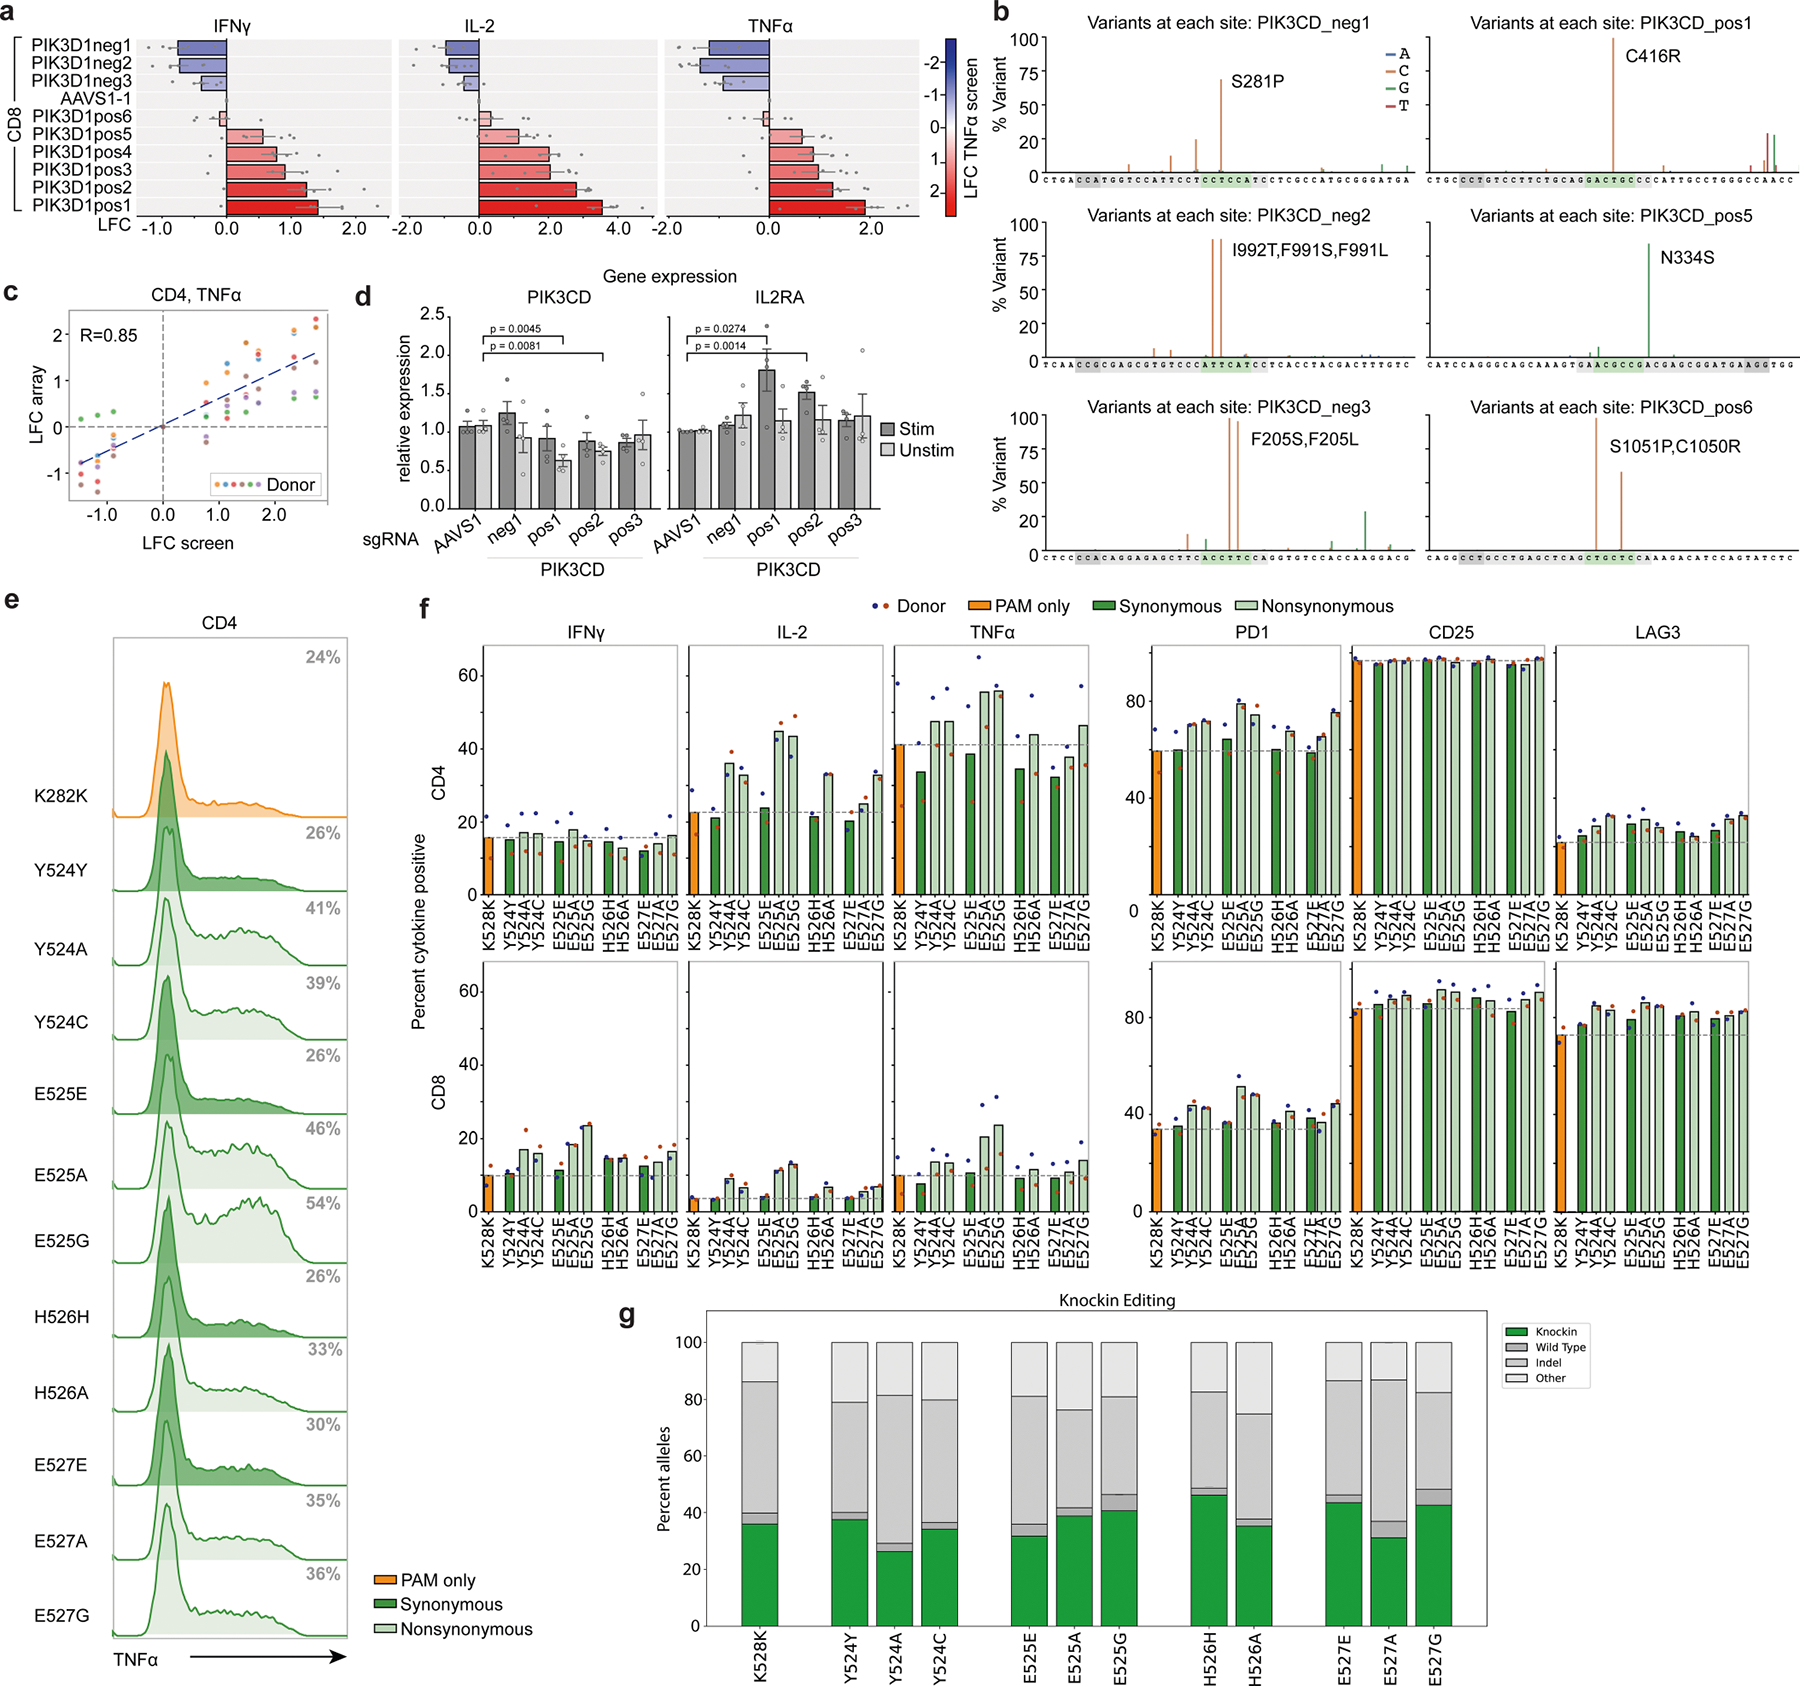
Extended Data Fig. 8 |. Characterization of a PIK3CD allelic series.

a, Bar graphs corresponding to Fig. 3i show LFC (log2-fold change) in expression of the indicated cytokines in arrayed validation for a series of 9 PIK3CD guides relative to AAVS1 control in CD8+ T cells; color indicates LFC (log2-fold change) value of each guide in the original ABE TNFα screen. n = 6 human donors, shown as mean ± SE. b, A-T to G-C editing by co-electroporation of ABE mRNA and synthetic PIK3CD sgRNAs, assessed by deep amplicon sequencing and analyzed with Crispresso254. Guide sequences are in gray, predicted editing window in green, and PAM in dark gray. c, Correlation between PIK3CD LFC (log2-fold change) values from the TNFα screen and validation experiment (Fig. 3i) in CD4+ T cells. d, mRNA expression of PIK3CD and IL2RA in PIK3CD edited T cells. Mean ± SD, n = 4 independent donors. e-g, Single amino acid substitution by CRISPR/Cas9 knockin. All edits include a synonymous K282K mutation deleting the PAM site. e, Flow cytometry histograms showing TNFα expression in CD4+ gated T cells. Percent positive cells in gray. f, Percent cytokine positive CD4+ and CD8+ gated T cells with the indicated knockins. n = 2 human donors (red and blue dots) shown as mean. g, Corresponding gene editing outcomes for knockin experiments as reported by CRISPResso2. n = 2 human donors shown as mean.
