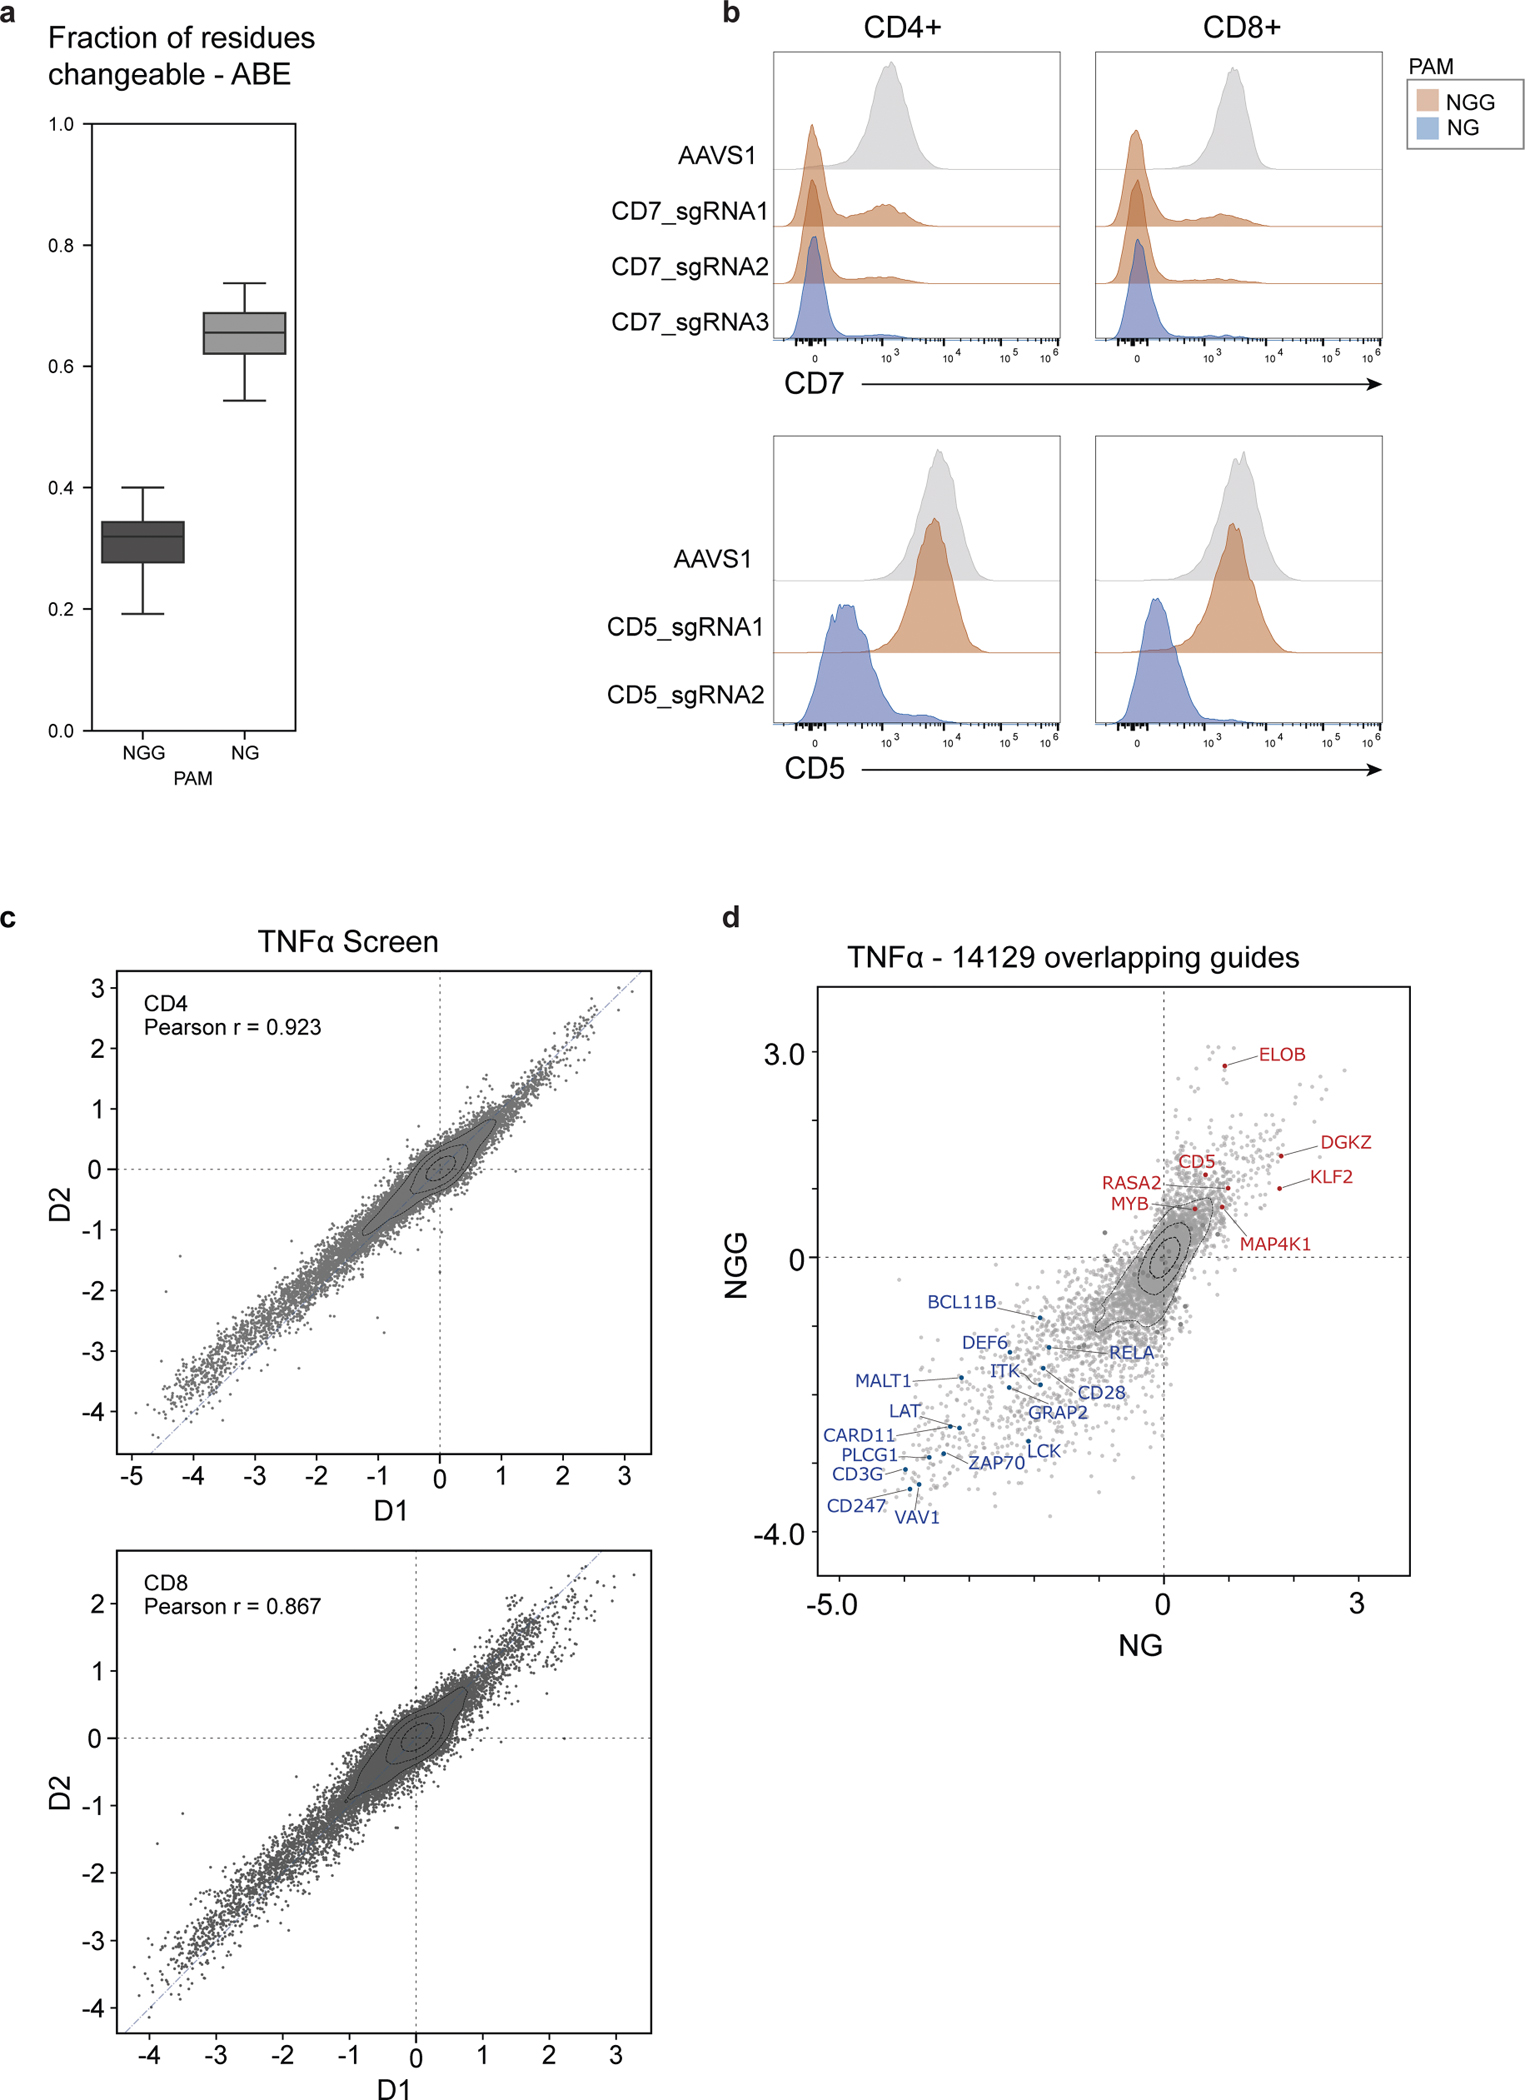
Extended Data Fig. 10 |. Establishment and performance of NG-PAM dependent base editing with SpG Cas9.

a, Predicted distribution of fraction of editable residues, within the original 385 genes in the NGG-PAM Cas9 screen, using either WT nCas9 (NGG PAM) or SpG Cas9 (NG PAM) for ABE. Box plots show median, center quartiles, and extremes within 1.5 * IQR. b, Distribution of surface protein expression levels for CD5 or CD7 in pan T cells gated for CD4+ (right) or CD8+ (left) base edited with one (CD5) or two (CD7) ABE NGG sgRNAs targeting each gene and one ABE NG sgRNA targeting each gene plus AAVS1 control. c, LFC (log2 fold changes) in the TNFα screens using WT nCas9 (NGG, y-axis) vs. using SpG Cas9 (NG, x-axis) for 13,334 overlapping guides between the two screens. The average knockout effect of specific genes present in both screens is shown with overlaid blue/red dots and labels. Knockout effects were calculated using the top 3 predicted knockout guides. d, Scatter plots showing LFC (log2-fold changes) of pairwise donor-to-donor correlations for each NG screen. Two human donors were used for all NG screens.
