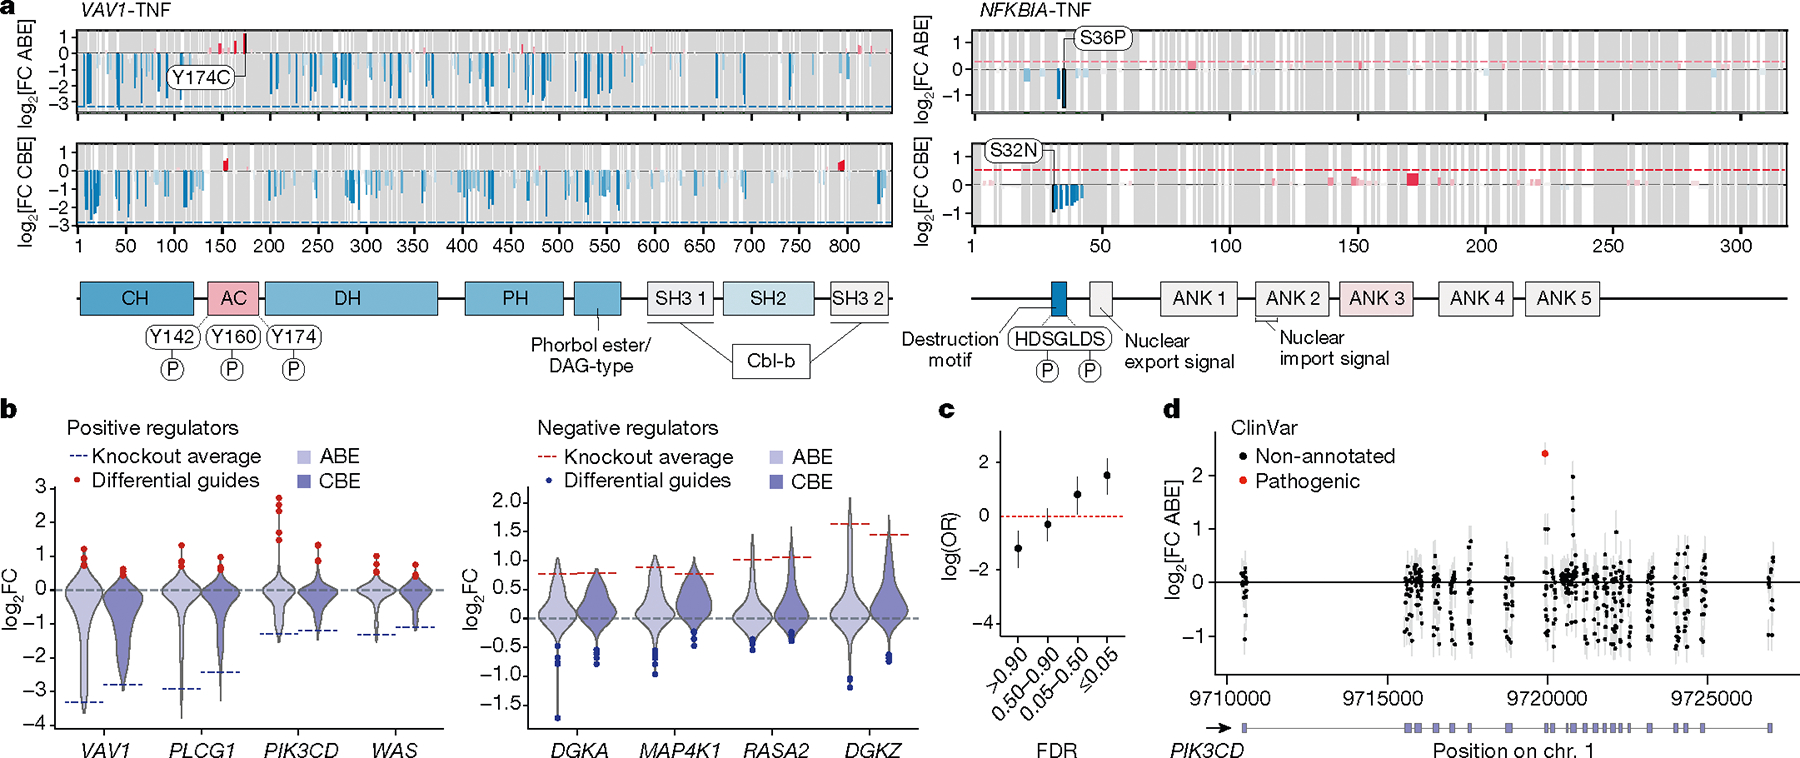
Fig. 2 |. Tiling base edits reveal functional protein domains across gene coding sequences.

a, Average effects log2FC of non-synonymous, non-terminating base edits at each residue (top, ABE; bottom, CBE) on TNF production are plotted across open reading frames encoding VAV1 (left) and NFKBIA (right). The dotted line indicates the average log2FC of the top three terminating (knockout) guides in the first half of the coding sequence, with blue for negative effects and red for positive effects on TNF levels. Annotated domains from UniProt are shown below and are coloured by the average effect of guides targeting those regions. Known phosphorylated residues within domains with gain-of-function mutations (discordant with knockout effect) are mapped. AC, acidic region; ANK, ankyrin repeats; CH, calponin homology; DAG, diacylgycerol; DH, Dbl homology domain; PH, pleckstrin homology domain; SH2, Src homology 2 domain; SH3, Src homology 3. b, Violin plots show distribution of log2FC of CBE and ABE guides tiling positive (left) and negative (right) regulator genes of TNF. Dotted lines indicate the average log2FC of the top three terminating (knockout) guides in the first half of the coding sequence. Blue and red dots indicate guides with strongly opposing effects with respect to the knockout guides for the same gene (discordant guides). c, Base-editing variants in the TNF ABE screen (from n = 3 donors) binned by MAGeCK guide-level false discovery rate (FDR) are plotted with the log odds ratio of overlap with ClinVar ‘pathogenic’ variants. d, Base-editing variants from the PD-1 screen (from n = 3 donors) across the PIK3CD locus. Those with an exact base-level match in ClinVar are coloured red. c,d, Error bars represent 95% confidence intervals.
