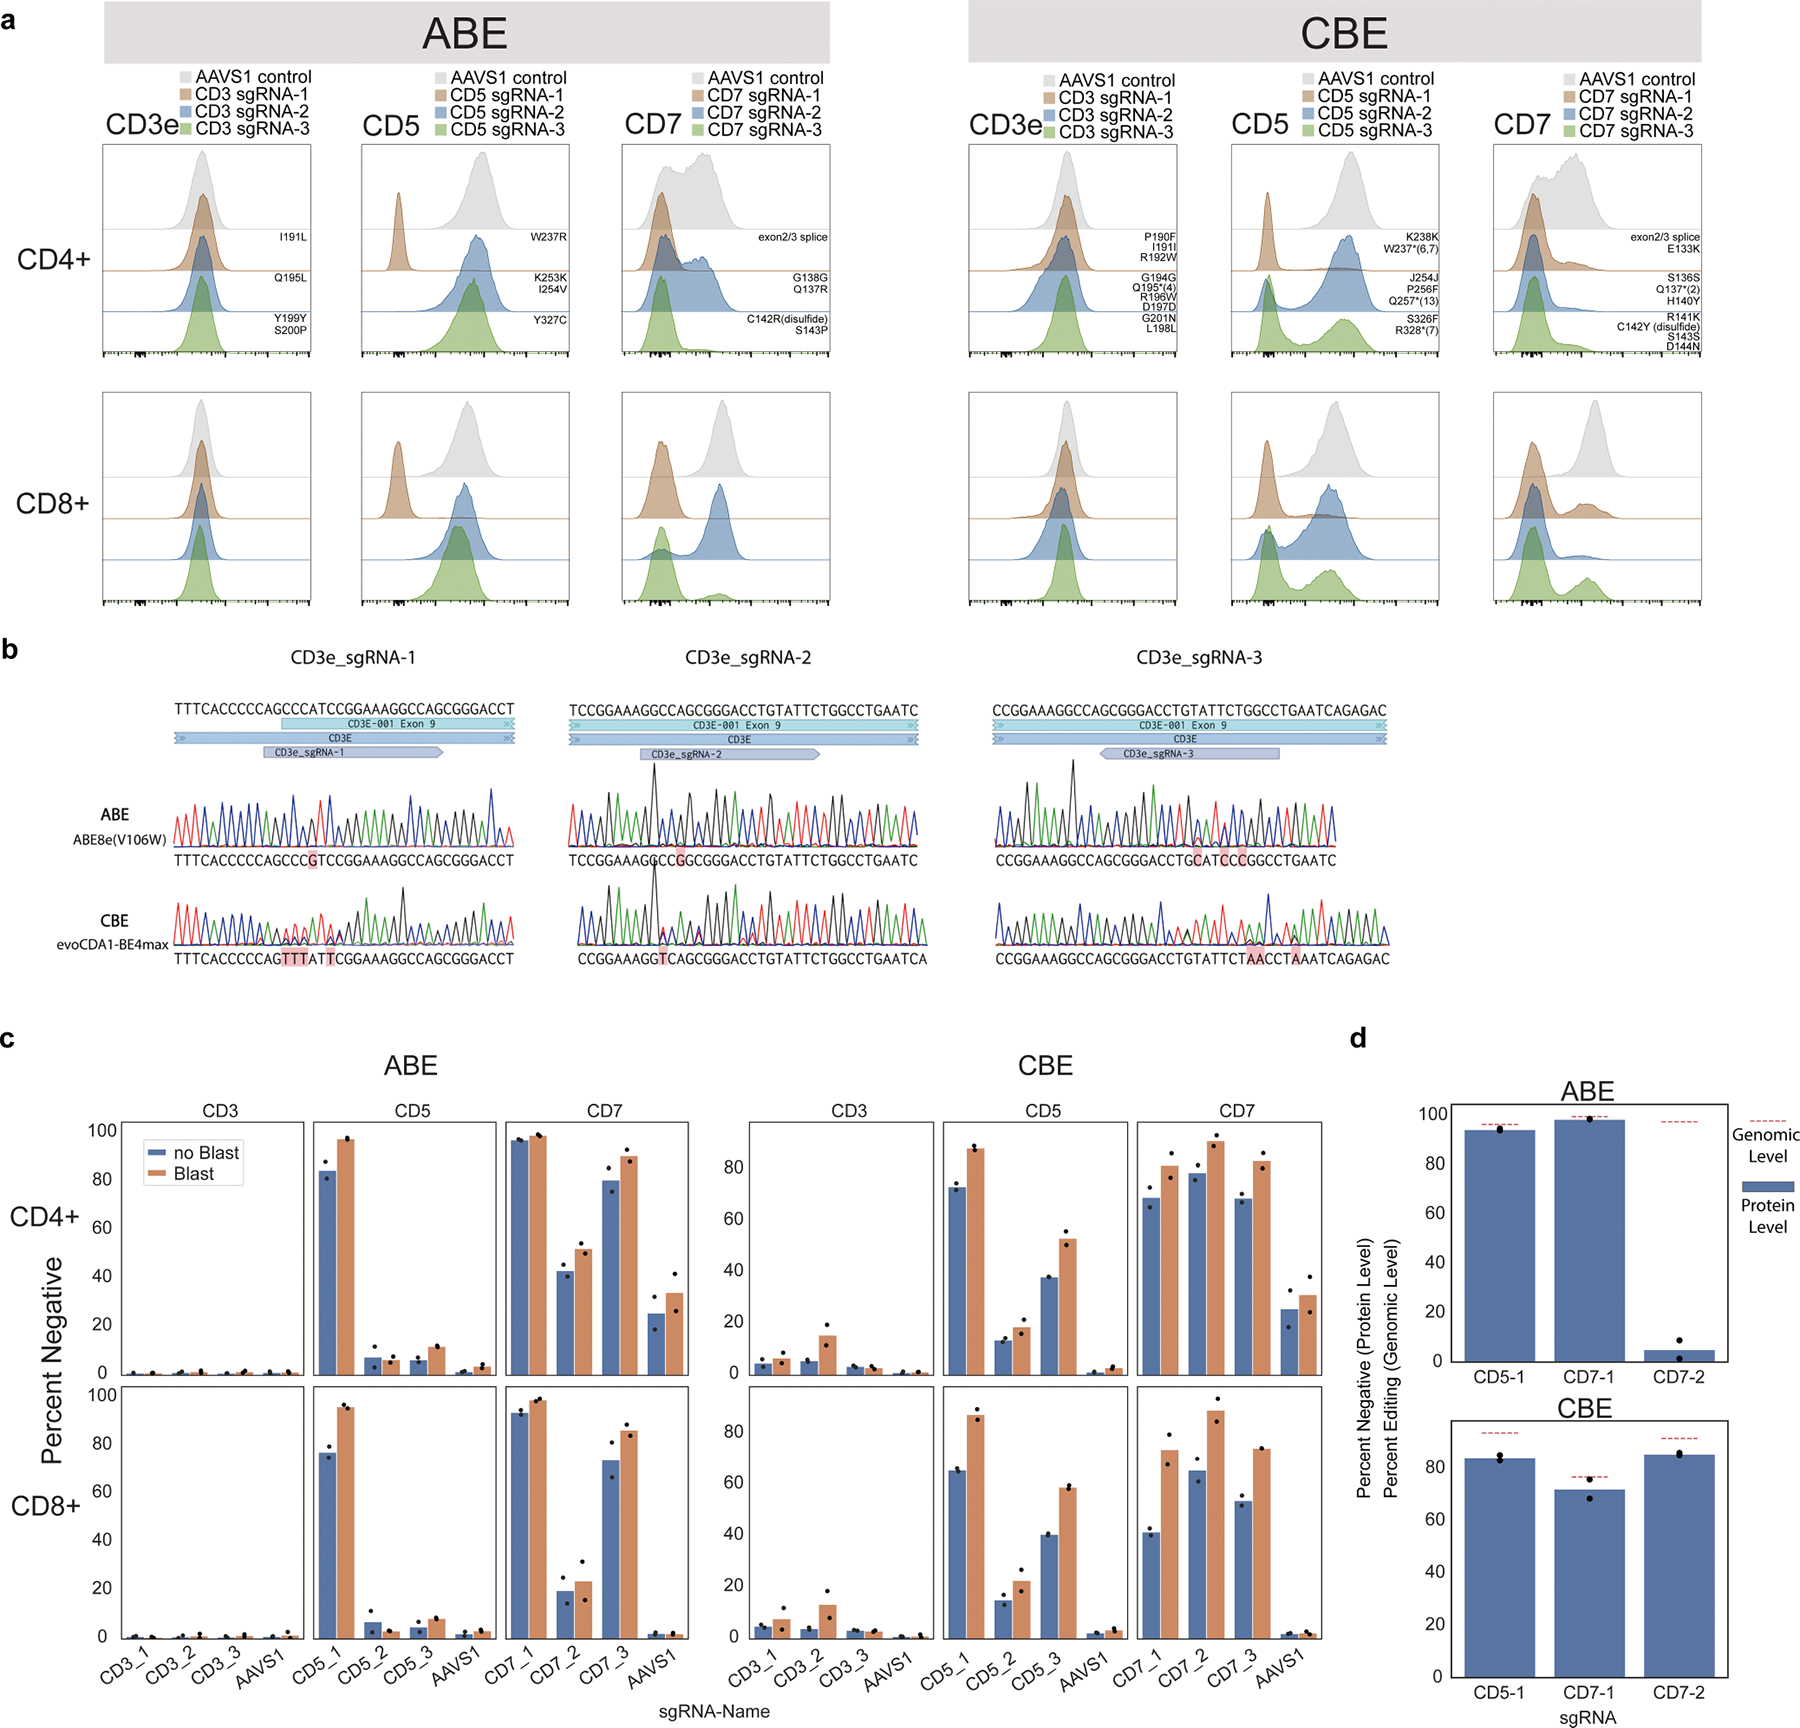
Extended Data Fig. 1 |. Optimization and assessment of base editing efficacy in primary human T cells.

a, Distribution of protein surface expression levels for CD3e, CD5, or CD7 in CD4+ or CD8+ T cells base edited with three sgRNAs targeting each gene or AAVS1 control with ABE (left) and CBE (right). Predicted mutations for each guide are annotated above each distribution in the CD4+ plots. n = 2 independent donors. b, Sanger sequencing traces for ABE and CBE editing using the three CD3e sgRNAs for both ABE and CBE. Consensus sequences are in black above and detected BE mutations are highlighted in red under traces. c, Summary boxplots of T cell editing outcomes expressed as % cells negative for CD3, CD5, or CD7 protein expression using the guides in (a), with (Blast) or without (noBlast) blasticidin selection. n = 2 independent donors. d, Protein level and genomic level editing for efficient sgRNAs targeting CD5 and CD7, shown as percent negative (flow cytometry, protein level) and percent edited (NGS, genomic level). Genomic level editing was analyzed with CRISPResso2. n = 2 independent donors for protein-level assessment and 1 matching donor for genomic-level assessments.
