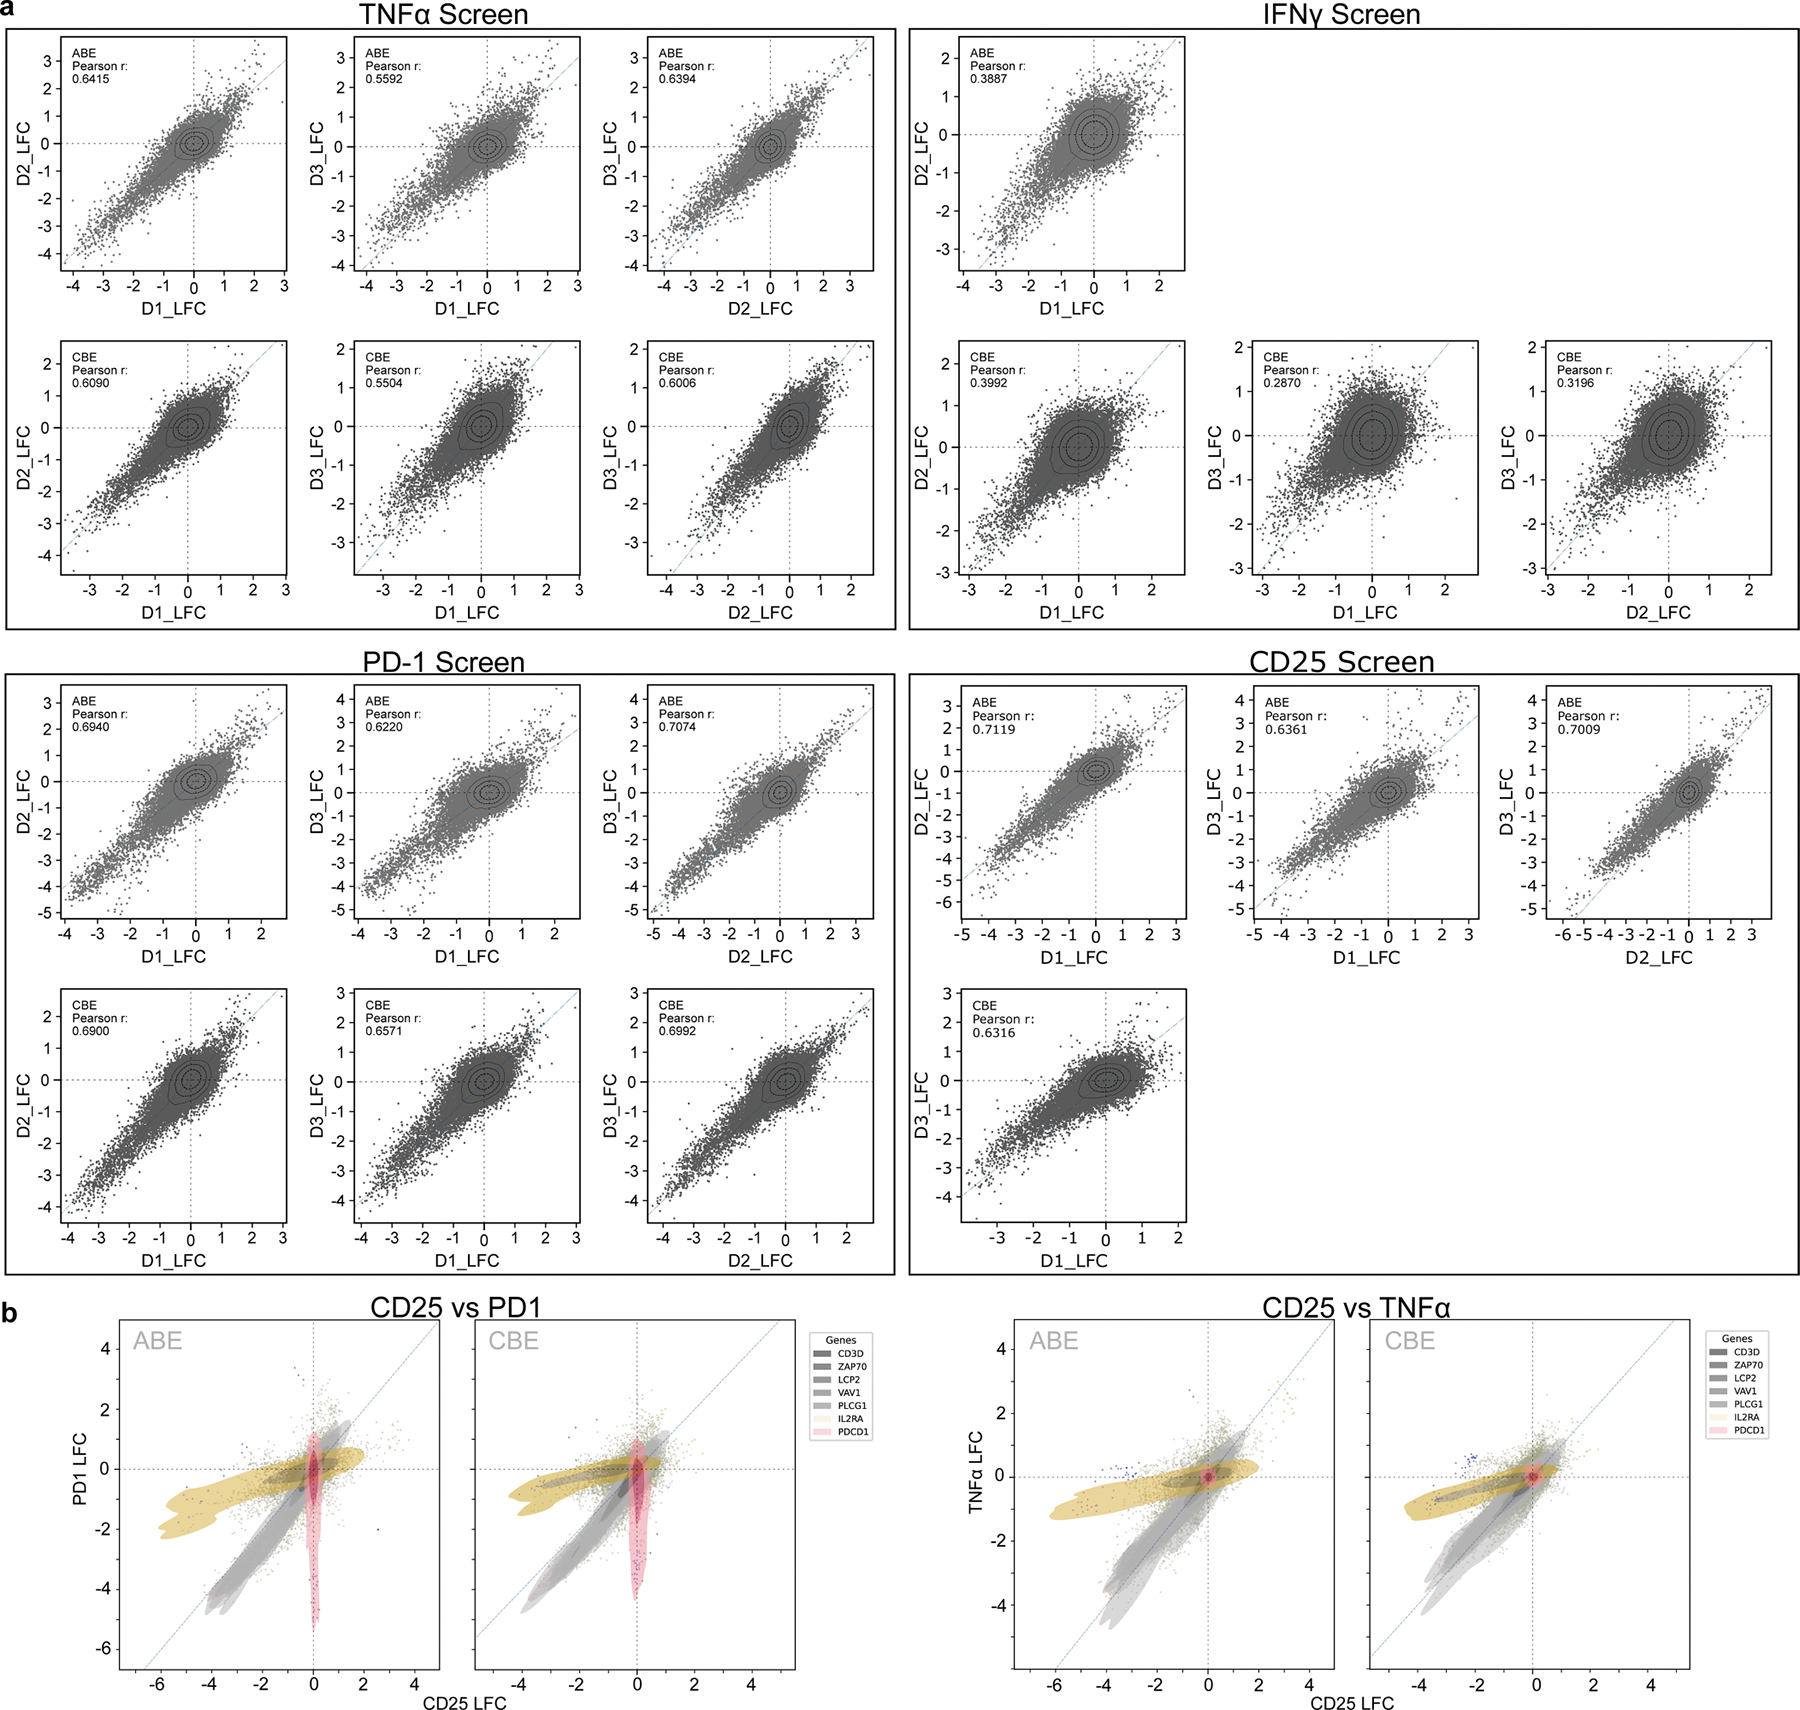
Extended Data Fig. 2 |. ABE and CBE screens are reproducible across human donors.

a, Scatter plots showing LFC (log2-fold changes) of pairwise donor-to-donor correlations (high/low bins) for each screen. Three human donors were used for all screens except the IFNγ-ABE and CD25-CBE screens, where two were used for analyses. Pearson correlation coefficient is given for each comparison. b, Comparison of sgRNA level effect sizes between CD25 and PD1 screens (left) or CD25 and TNFα screens (right), shown as LFC (log2-fold changes, high/low bins).
