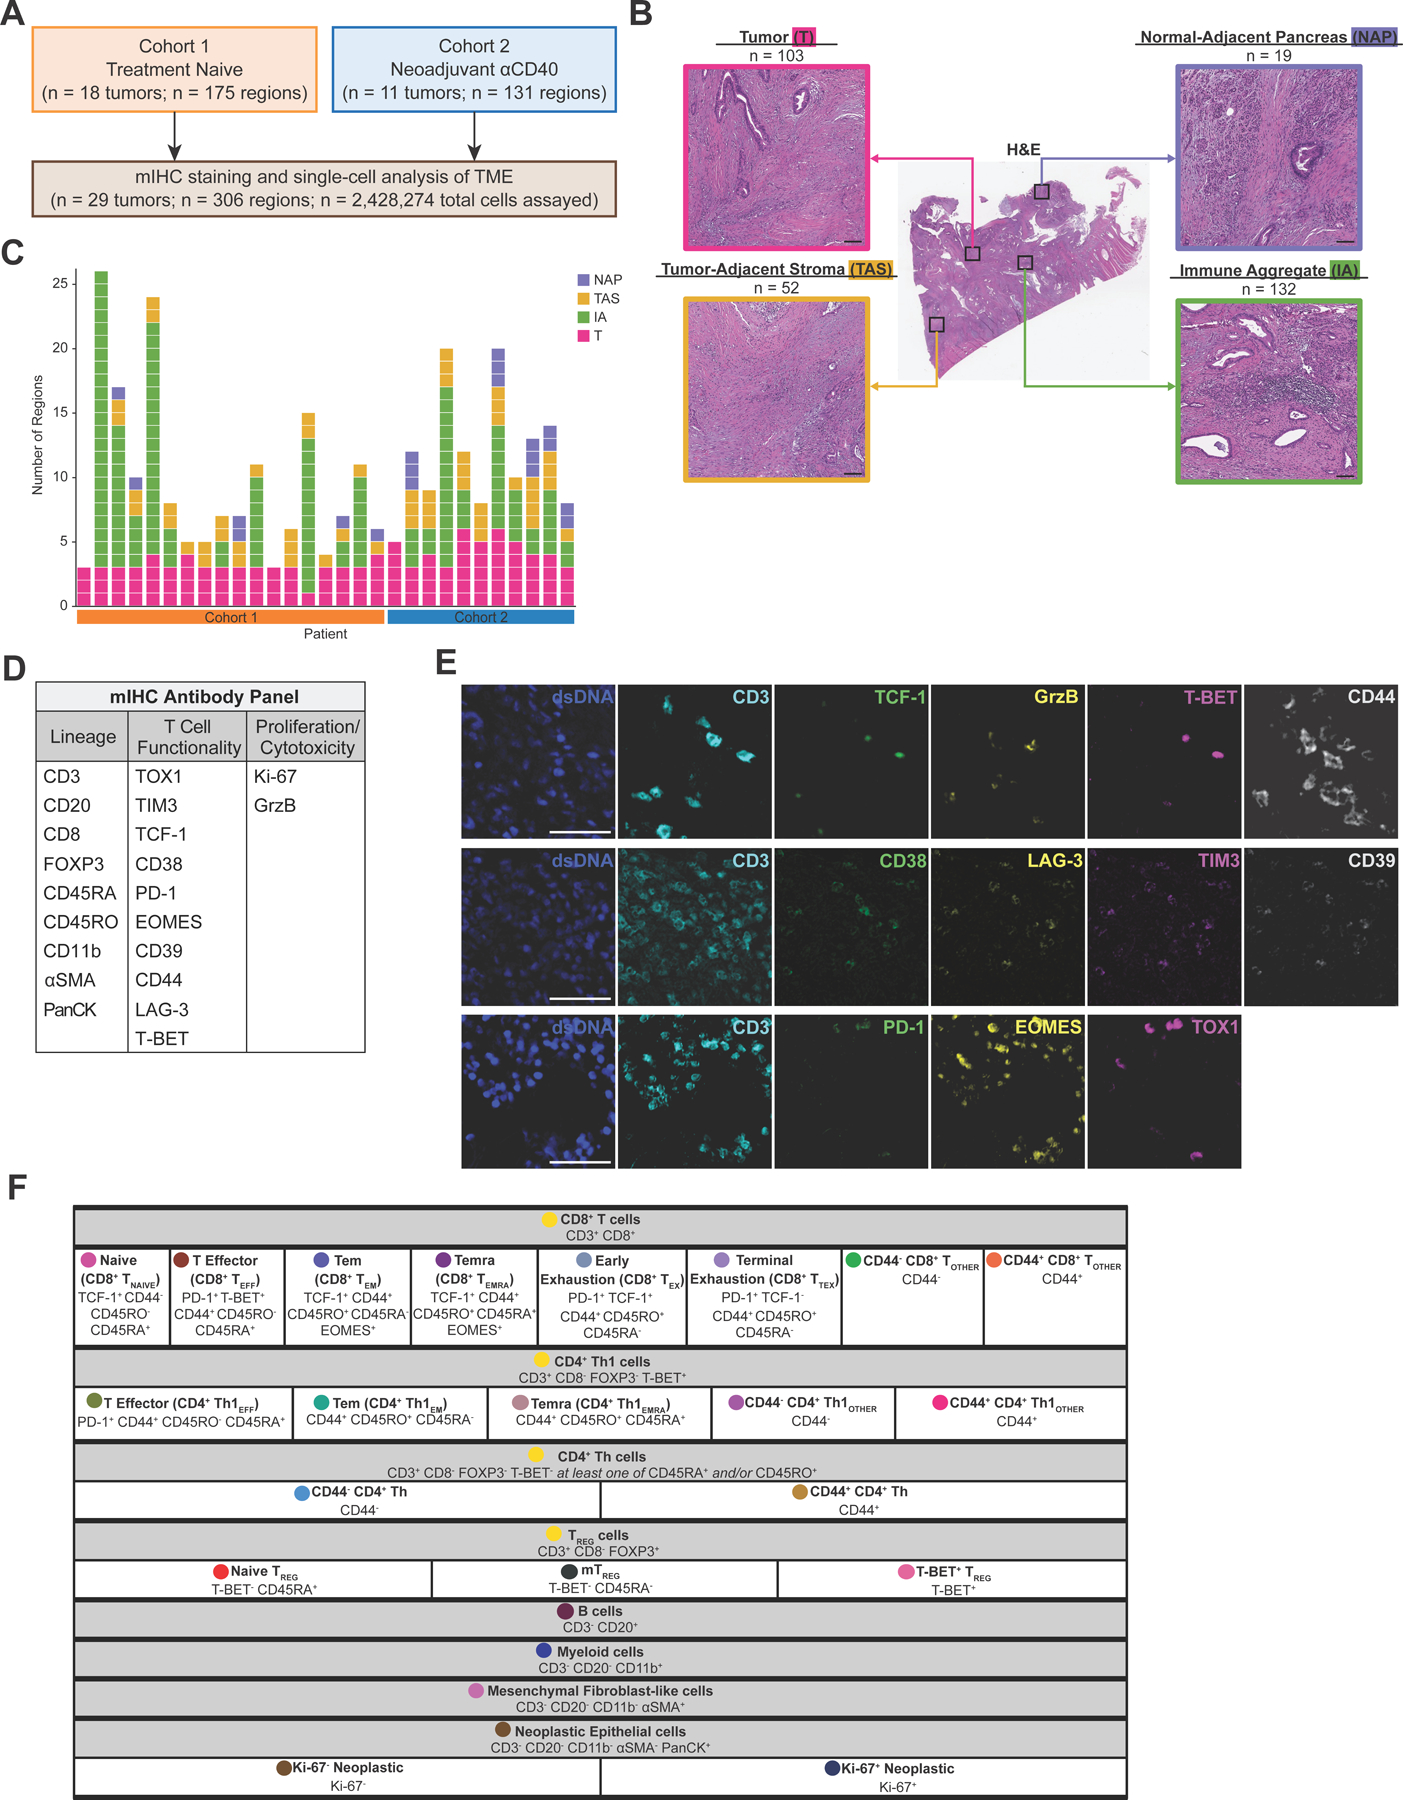
Figure 1. Deep phenotyping of T cells within the PDAC TME using mIHC.

A. Overview of two PDAC cohorts assayed via mIHC.
B. Representative PDAC tissue resection stained with H&E (middle) showing four histopathologic sites annotated. Total number of regions assayed per histopathologic site are listed. Scale bars = 100 µm.
C. Number of regions assayed per patient. Each box represents one tissue region and is colored according to its histopathologic site.
D. 21-antibody mIHC panel used to assay tissue regions.
E. Representative pseudo-colored mIHC images showing T cell functionality biomarkers with CD3 expression. Scale bars = 50 µm.
F. Cell phenotyping strategy by hierarchical gating of lineage and functional biomarkers. Circles indicate colors associated with each cell state in the following figures.
