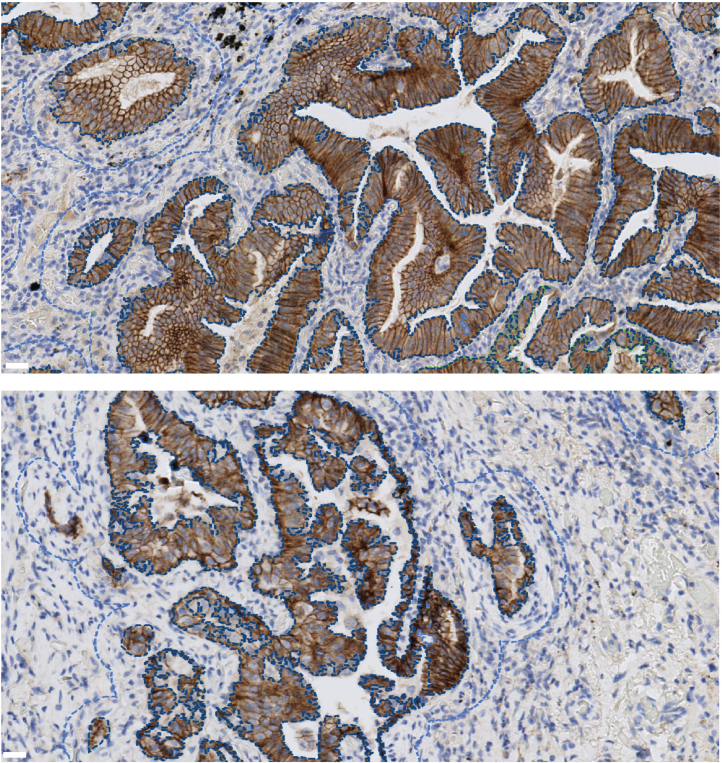
Extended Data Fig. 7. Width lining of ‘clustering’ areas of E-Cadherinover-expressed tumors.
Brown areas showing positive E-Cadherinover-expressing cells, with blue staining denoting nuclear staining. Blue dashed lining denoting area margin of 1.5 cm from the E-Cadherinover-expressing cells, determined using Visiopharm IHC APP algorithm (further detailed in Methods section). Scale white bar: 10 μm. Representative image from Patient 7. Similar APP algorithm applied to all 19 patients IHC analysis, with consistent observations.

