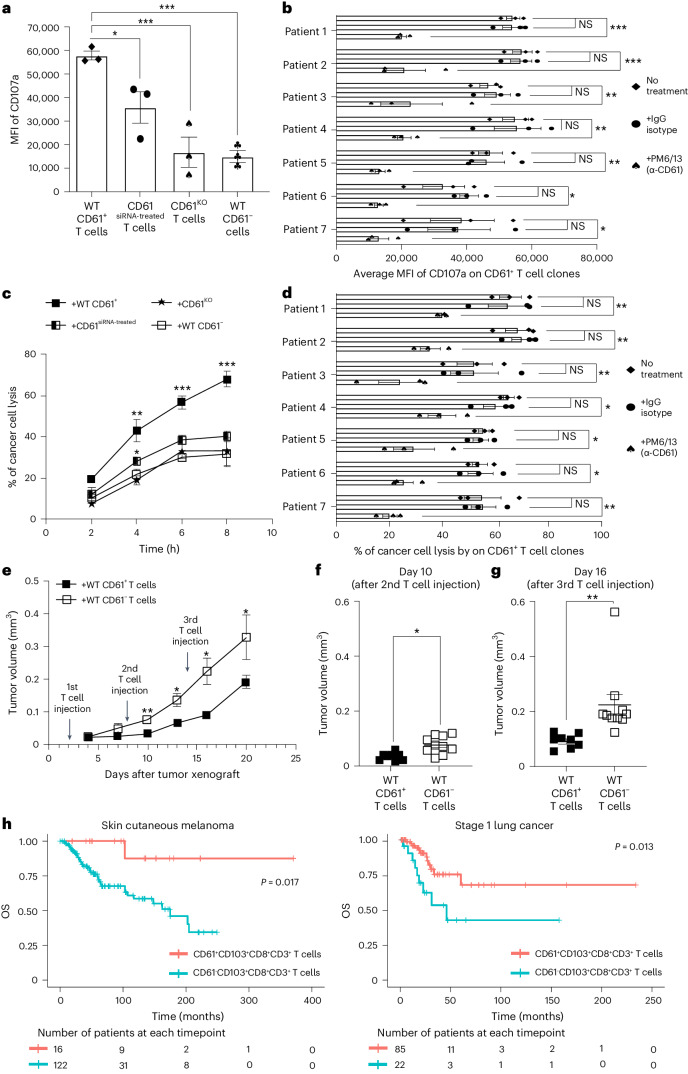
Fig. 4. CD61 improves cytotoxicity and tumor control.
a, Bar plot of CD107a MFI between NY-ESO-1-specific WT CD61+, CD61siRNA-treated, CD61KO and WT CD61− T cell clones (from patient 1) following activation with antigenic cancer cells, by flow cytometry. ♦, WT CD61+ T cell clone; •, WT CD61siRNA-treated T cell clone, ♠, WT CD61KO T cell clone; ♣, WT CD61−T cell clone. b, Horizontal bar graph showing CD107a MFI on CD61+ T cell lines following αCD61 neutralizing antibody treatment, IgG isotype control treatment or no treatment (n = 7 patients), by flow cytometry. P values: (patient 1: 0.00078, patient 2: 0.00089, patient 3: 0.0099, patient 4: 0.0053, patient 5: 0.0057, patient 6: 0.033, patient 7: 0.021). c, Line plot showing the percentage of cancer cell death, following co-culture with NY-ESO-1-specific WT CD61+, CD61siRNA-treated, CD61KO or WT CD61− T cell clones (from patient 1). d, Horizontal bar graph showing the percentage of cancer cell death, following co-culture with CD61+ T cell lines after αCD61 neutralizing antibody treatment, IgG isotype control treatment or no treatment (n = 7 patients). P values: (patient 1: 0.0078, patient 2: 0.0043, patient 3: 0.0097, patient 4: 0.047, patient 5: 0.049, patient 6: 0.04, patient 7: 0.007). e, Kinetic analysis of mouse tumor volume after adoptive transfer of either WT CD61+ or WT CD61− T cell clones (patient 1). The arrows show the timepoints of T cell injections. f,g, Dot plots of mouse tumor volume after the 2nd (day 10, P value: 0.048) or 3rd (day 16, P value: 0.0089) T cell injection of either WT CD61+ (black box) or WT CD61− (white box) T cell clones (from patient 1). h, Kaplan–Meier survival curves of patients with SCM and patients with stage 1 LC using TCGA dataset. Patient groups: (i) patients with CD61+CD103+CD8+CD3+ samples (G1, light red), or (ii) patients with CD61−CD103+CD8+CD3+ samples (G2, light blue). The starting number of patients with SCM analyzed: nG1 = 16 patients, nG2 = 122 patients. The starting number of patients with LC analyzed: nG1 = 85 patients, nG2 = 22 patients. One-way ANOVA, with Tukey’s multiple-comparison test. a,c. n = 3 independent experiments. b,d. n = 7 patients examined over three independent experiments. e–g, n+WT CD61+ T cells = 8 mice, n+WT CD61− T cells = 10 mice. a–g, Data are presented as the median ± s.e.m., denoted as ***P < 0.001, **P < 0.01, *P < 0.05, with either one-way ANOVA with Tukey’s multiple-comparison tests (a–e) or two-tailed t-test with Wilcoxon adjustment (f and g).

