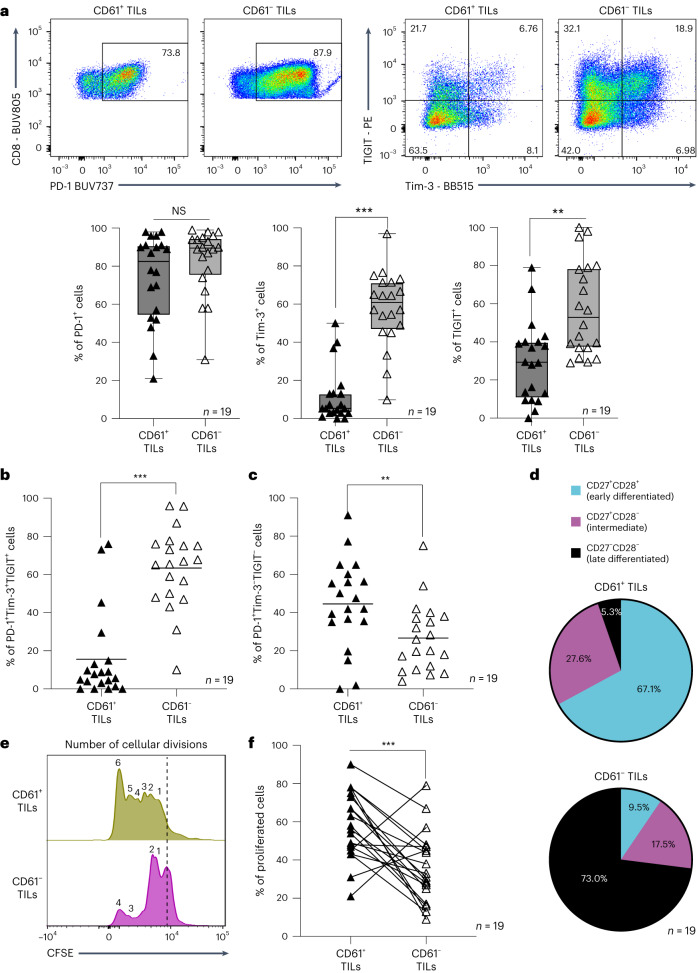
Fig. 6. CD61+ TILs do not exhibit hallmarks of exhaustion.
a, The expression of PD-1, TIGIT and Tim-3 by representative flow cytometry plot of patient 6 (top) and the frequency of PD-1+, Tim-3+ and TIGIT+ cells by box-and-whisker plots (bottom) between CD61+ TILs and CD61− TILs. Data are presented as the median ± s.e.m., with center percentile. P values (Tim-3: 0.00045, TIGIT: 0.0034). b,c, Dot plots on the frequency of triple coexpressed PD-1+Tim-3+TIGIT+ cells and PD-1+Tim-3-TIGIT−cells between CD61+ TILs and CD61− TILs. b, P value: 0.00083. c, P value: 0.0089. d, Pie charts showing percentages of cells in the early-differentiated stage (CD27+CD28+), intermediate differentiated stage (CD27+CD28−) and late differentiated stage (CD27−CD28−) between CD61+ TILs and CD61− TILs. e, Representative histogram plot (from patient 7) of cells undergoing cellular divisions (denoted by the number of CFSE peaks) between CD61+ TILs and CD61− TILs. Peaks at the dashed line represent cells that are not proliferating. f, Line plot of proliferated cells between CD61+ TILs and CD61− TILs. P value: 0.00097. ***P < 0.001, **P < 0.01, two-tailed t-test with Wilcoxon adjustment (a–c and f). a–d and f, n = 19 patients.

