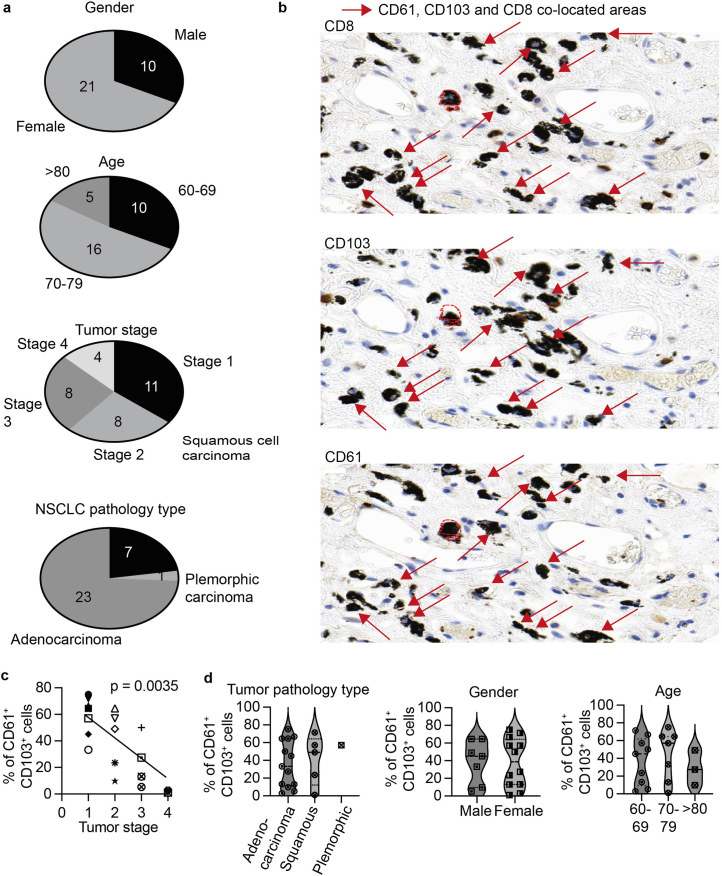
Extended Data Fig. 3. Summary of clinical parameters and CD61 expression on TILs ex vivo.
a, Pie charts on the summary clinical parameters of NSCLC patients, according to gender, age, tumour stage and NSCLC pathology type, used in this study. b, Representative IHC images of CD8, CD103 and CD61 on three serial tumour resections, from one NSCLC patient. The red arrow represents areas of co-localisation between CD8, CD103 and CD61. Red dotted lines indicate the alignment of the serial tumour resections performed by Visiopharm. Scale white bar: 5μm. Representative image from Patient 7. Similar APP algorithm applied to all 19 patients IHC analysis, with consistent observations. c, Plot showing frequency of CD61+ cells (out of the total CD103+ TILs) and the tumour stage of each patient. Each variety of dots represents an individual cancer patient. p-value = 0.0035. Correlation analyses were performed using non-parametric Spearman rank correlation. d, Violin plots showing the frequency of CD61+ cells (out of total CD103+ TILs), according to tumour pathology type, gender and age. a,c-d. n = 19 patients.

