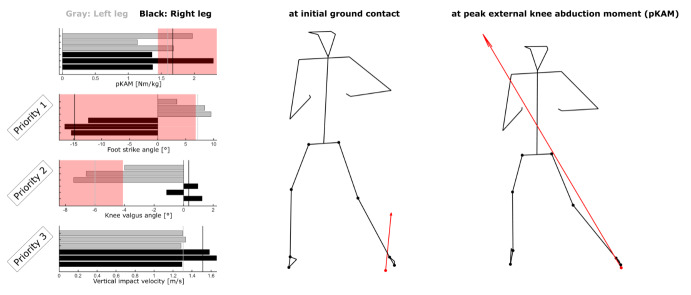
Figure 2. Visual feedback provided to a player after three baseline (PRE) cuts per leg.
The left and right stick figures represent the player’s posture during the most recently performed cut at initial ground contact and at peak external knee abduction moment (pKAM), respectively. The bar graphs from top to bottom indicate pKAM within the first 60 milliseconds of stance, foot strike angle (FSA), knee valgus angle (VAL), and vertical impact velocity (VIV). Gray bars represent left-legged cuts, black bars represent right-legged cuts, vertical lines represent means over three cuts. Red patches indicate values exceeding the cut-off (not shown for VIV since magnitudes for this player were well below that cut-off). This player went on to receive FSA feedback for the right leg and VAL feedback for the left leg.

