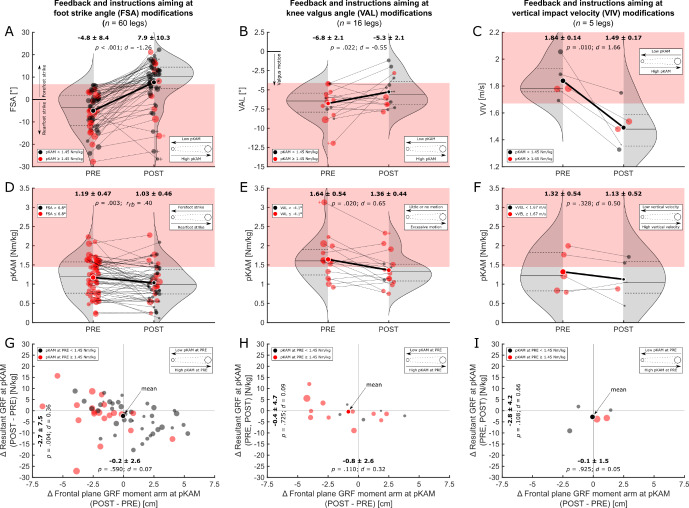
Figure 4. Results for the three feedback-instruction combinations targeting the foot strike angle (FSA; left column), knee valgus angle (VAL; middle column), and vertical impact velocity (VIV; right column).
- – C): Technique at baseline (PRE) and after feedback (POST). The left portion of each figure shows the technique at baseline (PRE) while the right portion shows the technique after feedback (POST). Red patches in the background represent values exceeding the respective technique variable’s cut-off. Dots represent individual legs, and dots with white edges represent means. To relate these values to each leg’s peak external knee abduction moment (pKAM), larger dots indicate higher pKAM, and black and red dots indicate legs below and above the pKAM cut-off, respectively. Gray-shaded areas represent the distribution density with horizontal lines indicating interquartile ranges and medians.
- – F): pKAM at baseline (PRE) and after feedback (POST). The left portion of each figure shows the pKAM at baseline (PRE) while the right portion shows the pKAM after technique feedback (POST). Red patches in the background represent values exceeding the pKAM cut-off. Dots represent individual legs, and dots with white edges represent means. To relate these values to each leg’s technique, larger dots indicate more unfavorable technique, and black and red dots indicate values below or in excess of the respective technique variable’s cut-off, respectively. Gray-shaded areas represent the distribution density with horizontal lines indicating interquartile ranges and medians.
- – I): Absolute changes in the resultant ground reaction force (GRF) at pKAM (vertical axis) and its frontal plane moment arm (horizontal axis). Larger dots indicate higher pKAM at baseline (PRE), and black and red dots indicate pKAM magnitudes below and above the pKAM cut-off, respectively.

