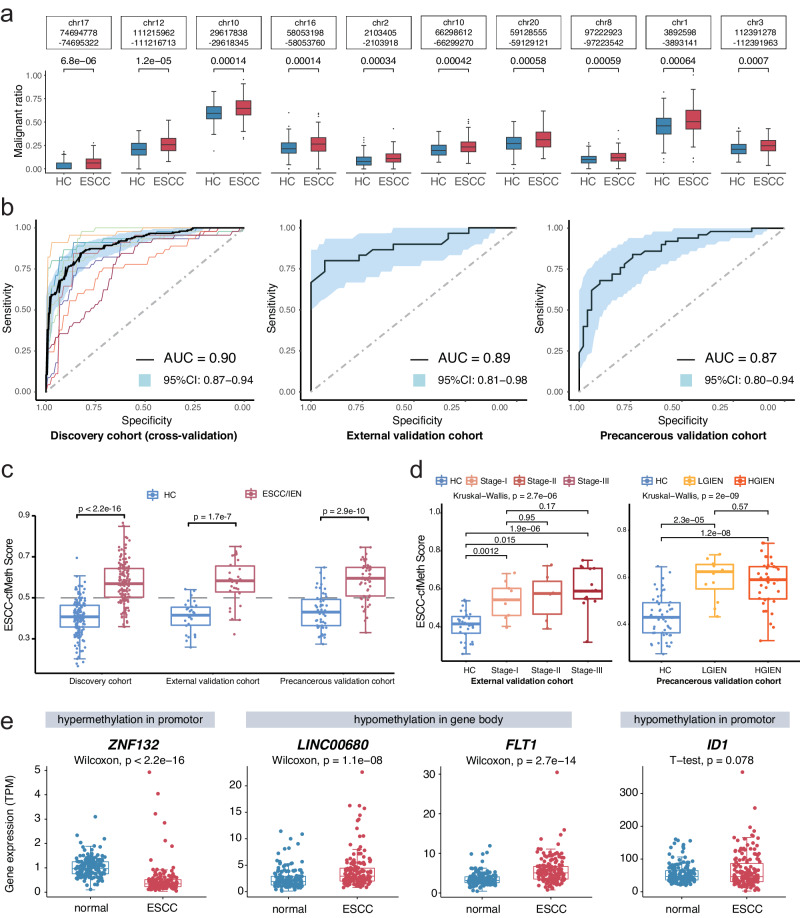
Fig. 2. Cell-free DNA methylation markers and their detection performance for esophageal squamous cell carcinoma.
a Among the differentially methylated regions (DMRs) identified in esophageal squamous cell carcinoma (ESCC) tissues, 650 DMRs were recalled through an adjusted p value < 0.05 (two-sided Wilcoxon test), favoring DMRs with ESCC average values (n = 150) more significant than healthy controls (n = 150) in the discovery cohort, as determined by the malignant ratio. The figure shows malignant ratios with the p value of the top ten DMRs as examples. Data are presented as median values with maximums and minimums. b The diagnostic performances of the ESCC-cfMeth score were evaluated in the discovery cohort (tenfold cross-validation, the curve of each color indicating one cross-validation), the external validation cohort, and the precancerous validation cohort. The black curves represent the receiver operating characteristic (ROC) curves and the blue areas indicate the 95% confidence intervals (CI). c The final prediction model (ESCC-cfMeth score) was constructed using the cfDNA malignant ratios of the optimal 50 markers. The ESCC-cfMeth scores were significantly higher in patients with ESCC and intraepithelial neoplasia (IEN) than the HCs in the discovery cohort and the validation cohorts (two-sided Mann–Whitney U-test, p < 0.01). Data are presented as median values with maximums and minimums. d Compared to the HCs, the ESCC-cfMeth scores were robustly elevated among ESCCs of different stages (left; n = 30, 9, 6, and 15, respectively) and IENs (right; n = 50, 12, and 38, respectively). Data are presented as median values with maximums and minimums. e Differential expression of functional genes was found within the 50 optimal DMRs in comparison of gene expression between ESCC tissues and paired adjacent non-neoplastic tissues (n = 155) using a two-sided Wilcoxon test or t test (p < 2.2 × 10⁻¹⁶ for ZNF132, p = 1.1 × 10⁻⁸, 2.7 × 10⁻¹⁴, and 0.078 for LINC00680, FLT1, and ID1, respectively). Data are presented as median values with maximums and minimums. ESCC esophageal squamous cell carcinoma, IEN intraepithelial neoplasia, LGIEN low-grade IEN, HGIEN high-grade IEN, HC healthy control, DMR differentially methylated region, AUC area under curve, CI confidence interval. Source data are provided as a Source Data file.

