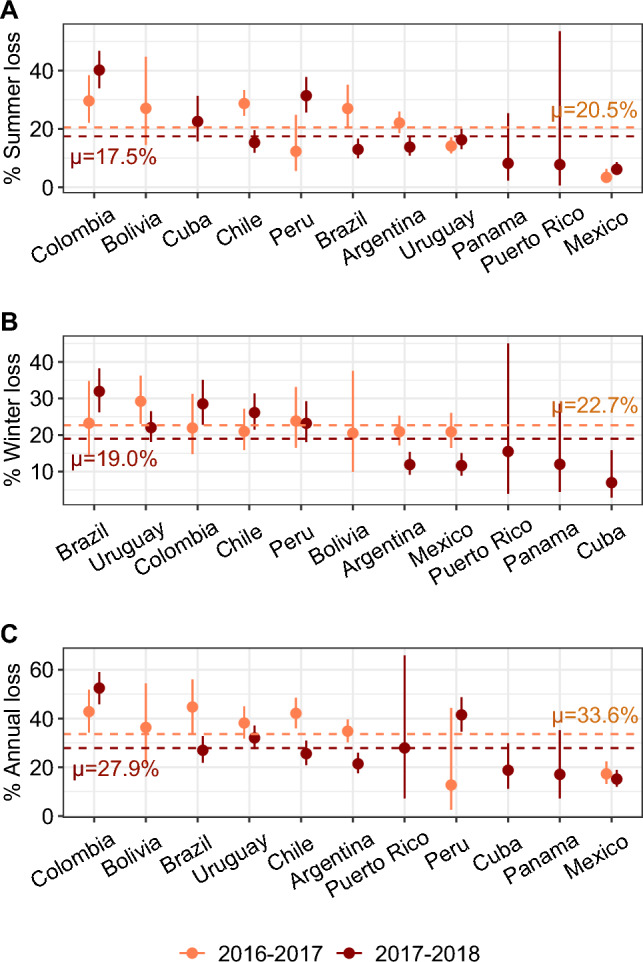
Figure 3.

Honey bee colony loss for (A) summer, (B) winter, and (C) annual periods in Latin America. Dots represent the predicted total loss per country and year, with thick lines indicating the 95% CI (based on GLM predictions). Countries are ordered by decreasing loss values. The colors distinguish the two years of the data collection (2016–2017 in orange and 2017–2018 in brown). Horizontal dashed lines represent the average value for Latin America with different colors when the year effect was significant.
