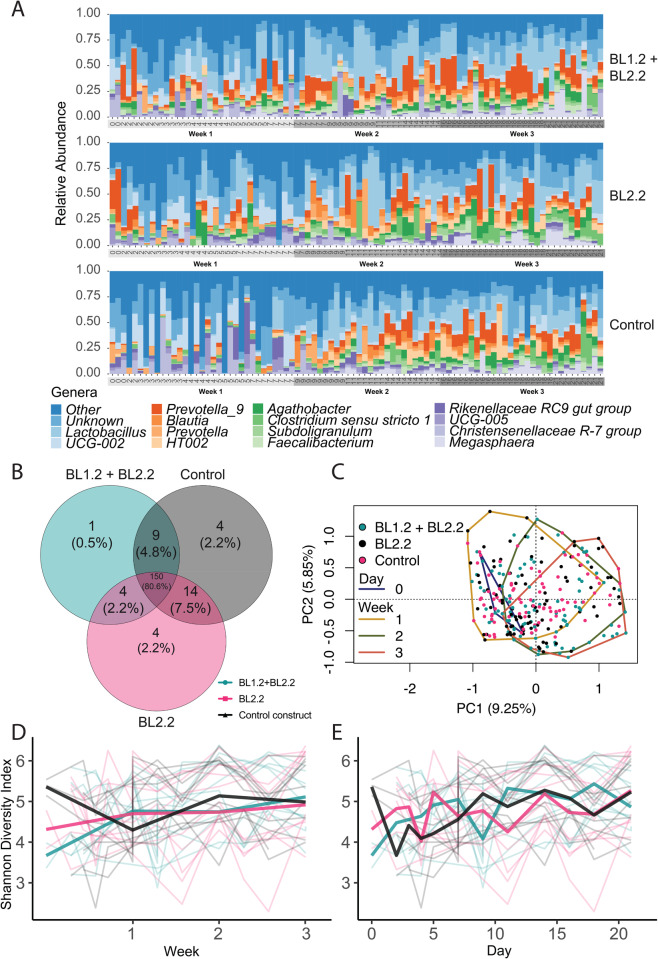
Fig. 5. Overall temporal changes in the faecal microbiota upon ETEC challenge and supplementation with VHH constructs from postweaning day 0 to 21.
A Genus-level composition across piglet groups. 16 most abundant genera depicted, with remaining collapsed as “other”. Each bar represents individual piglets at the given sampling time point (ordered chronologically). B Venn diagram of genus-level composition across piglet groups (circle size does not correspond to numerical values). C PCA plot of beta diversity of piglet faecal microbiota, based on Euclidean distances of CLR-transformed counts (ASVs). Temporal shifts in microbiota composition are evident as the analysis shows a progression across weeks, with convex hulls representing each week’s aggregate data. However, within each group (indicated by distinct colors: cyan for BL1.2 + BL2.2, black for BL2.2, and magenta for Control), the composition remains consistent, with no notable divergence between the groups over time. The background points display individual Shannon diversity values per piglet, while the bold lines chart the weekly average diversity within each group. D and daily averaged diversity (E). Visualisation of taxonomic compositions were generated from raw ASV counts as a proportion of total sample counts (relative abundance). Alpha diversity was calculated based on the Shannon index, a robust estimation of both species richness and evenness. Shannon diversity was explored overall, across each group, and between each group at weekly intervals. Holm–Bonferroni correction was applied for all multiple comparisons. See also Supplementary Figs. 4–7, and 9.

