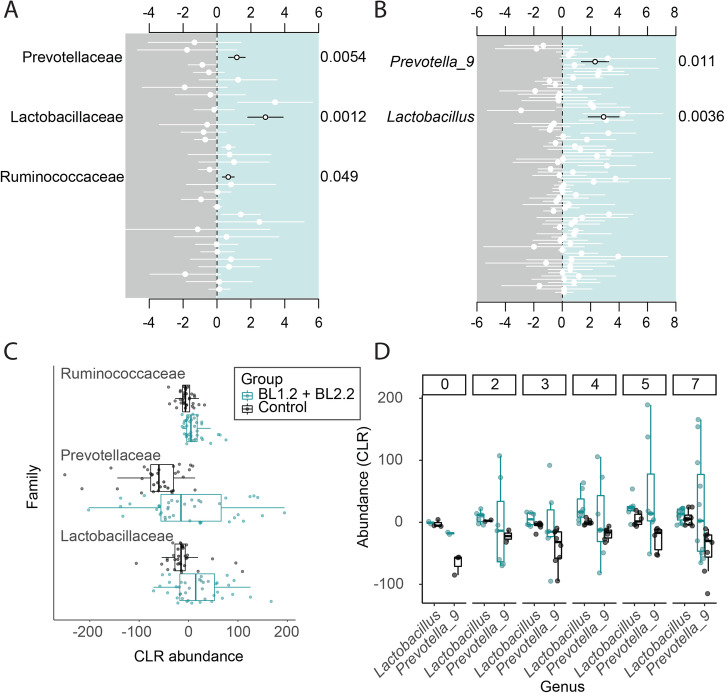
Fig. 6. Differentially abundant taxa within week 1 for piglets receiving BL1.2 + BL2.2 vs. VHH controls.
Differentially abundant taxa at the family level with only significant taxa annotated (A) and genus level (B). Negative binomial regression coefficients for significantly different taxa in BL1.2 + BL2.2 (blue) group, compared to control group (grey). Circles represent coefficients, with the standard error shown as bars. Adjusted P-values (Holm–Bonferroni) are shown on the right-hand side of the plots. Only significantly different genera are labelled (black). CLR abundances of differentially abundant families overall (C) and changes in genera during week 1 (D). See also Supplementary Fig. 8. Centre line corresponds to mean, bounds of box to lower and upper quartile and whiskers correspond to min and max. Error bars represent SD.

