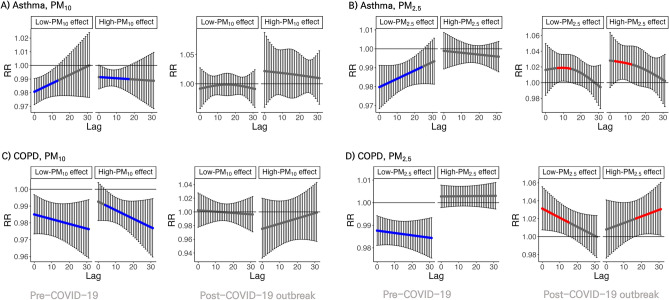
Figure 4.
Extreme effect of and on admissions of Asthma and Chronic obstructive pulmonary disease (COPD). Extreme effect of and on admissions of Asthma and COPD as high-low effect plots for multivariate meta-analyses. High effect and low effect mean a 90th quantile value versus the median value of in Seoul and a 10th quantile value versus the median value of in Seoul, respectively. The dot means the point estimator of the relative risk, and the bar means the 95% interval. If the confidence interval is greater than 1, the dot has a red colour, and if it is less than 1, it has a blue colour. (A) and (B) represent the results for Asthma, which are shown in a row in the Pre-COVID-19 and Post-COVID-19 outbreak period. (C) and (D) represent the results for COPD, which are shown in a row in the Pre-COVID-19 and Post-COVID-19 outbreak period.

