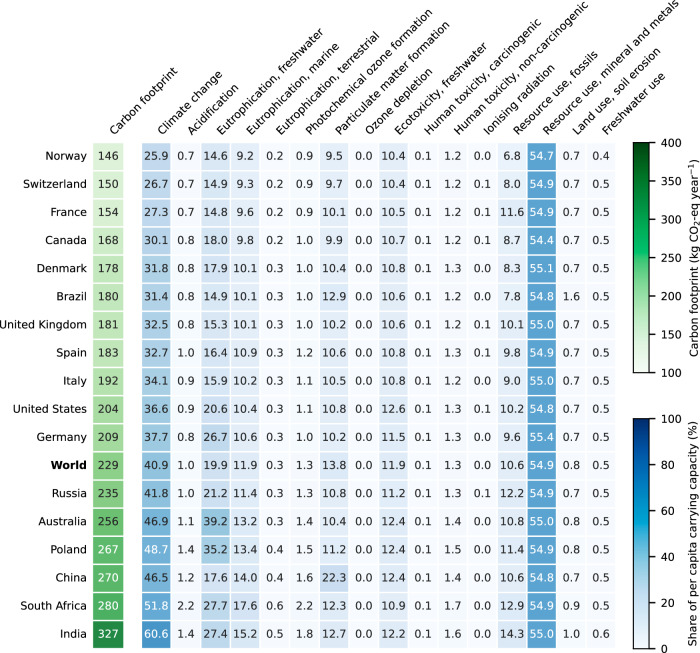
Fig. 2. Carbon footprint and share of per capita carrying capacity required by digital content consumption.
Impacts for a user archetype representing the global average consumption patterns across all Internet users. Rows in the heatmap correspond to the electricity mix of various countries ranked according to the carbon footprint (the global average electricity mix is labelled in bold). Very high impacts (global average >40%) are found in climate change and mineral and metal resources use, making it very hard to not transgress the Earth’s carrying capacity considering the remaining goods and services consumed by individuals (i.e., the entire environmental footprint of each individual should not exceed 100%). For more detailed information on the impact assessment methods, their robustness, and the corresponding carrying capacities, see “Methods” section and Supplementary Table 8.

