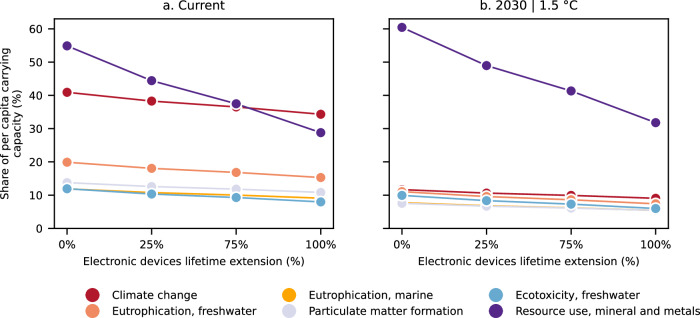
Fig. 5. Share of per capita carrying capacity required by digital content consumption over a year vs. electronic devices lifetime extension.
Impacts for a user archetype representing the global average consumption patterns across all Internet users considering a the current electricity mix scenario and b a 2030 electricity generation scenario compatible with limiting global warming to 1.5 °C. Only the most critical impact categories are displayed (fossil resources use is omitted since it is strongly connected with the climate change category). For more detailed information on the impact assessment methods used and their robustness and the corresponding carrying capacities, see “Methods” section and Supplementary Table 8.

