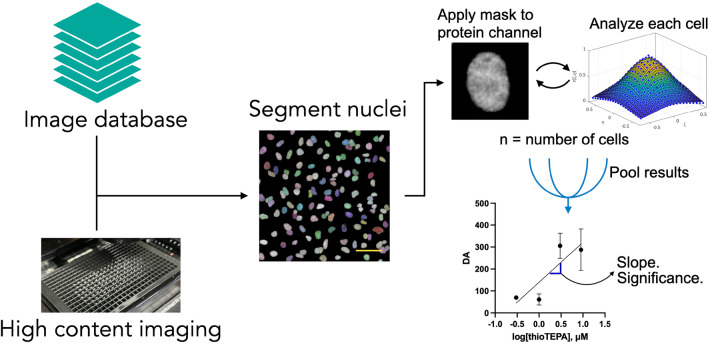
Figure 1.
Autocorrelation analysis of screens or experiments. Images were accessed from the screen database or the microscope computer. Individual nuclei from each image where then segmented using Stardist on the BFP or DAPI channel. The nuclei mask was then applied the protein of interest channel and each cell was individually analyzed. Cells from all images at each condition were then pooled and the average and standard deviation were determined. A linear regression of autocorrelation DA versus compound concentration was then performed and the slope and significance versus the null hypothesis (slope = 0) were calculated to determine compound activity. Scale bar = 60 μm.

