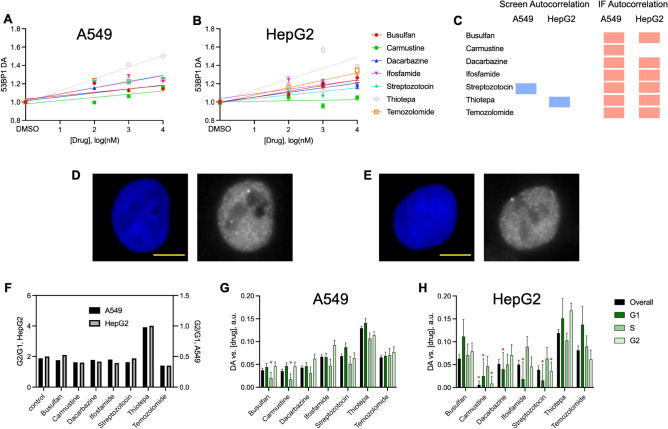
Figure 4.
Experimental analysis of 53BP1 with non-binned pixels in imaging. (A and B) 53BP1 DA as a function of drug dose in A549 (A) and HepG2 (B) cells. Data are average with SEM, n > 1015 cells over 7 biological repeats for each condition, and linear regression. (C) Activity results of autocorrelation analysis response to alkylating agents. Shown are significant dose dependent reduction in clustering (blue), significant dose dependent increase in clustering (red) and no significance (no marker). (D) Representative DAPI (blue) and 53BP1 (white) images of an A549 cell treated with DMSO, scale bar 4 μm. (E) Representative DAPI (blue) and 53BP1 (white) images of an A549 cell treated with 1 μM Thiotepa, scale bar 4 μm. (F) Cell cycle classification G2/G1 ratio of all the cells analyzed following 1 μM treatment for 24 h of each compound. (G and H) Autocorrelation DA versus concentration linear regression slope for all cells (overall) and cells in each of the cell cycles for each of the alkylating agents in A549 (E) and Hep2 (F) cells. Shown are linear regression slope with standard error of the fit, red asterisks indicate responses that were not significantly different from zero (F number).

