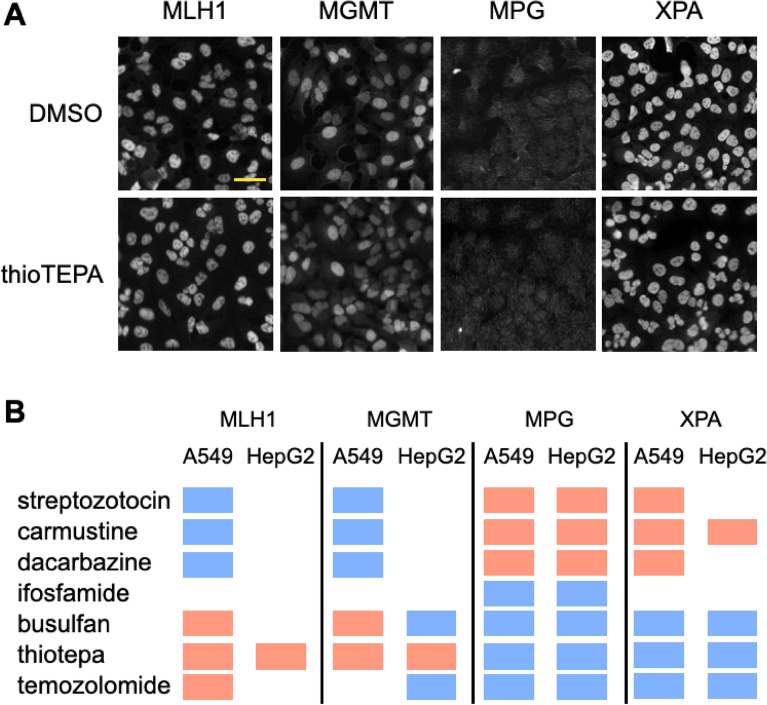
Figure 5.
Autocorrelation analysis of DNA damage response proteins. (A) Representative immunofluorescence images of proteins in A549 cells. Cells were treated for 24 h with either DMSO or 1 μM thiotepa, scale bar = 40 μm. (B) Activity results of autocorrelation analysis for each protein in response to alkylating agents. Shown are significant dose dependent reduction in clustering (blue), significant dose dependent increase in clustering (red) and no significant response (no marker).

