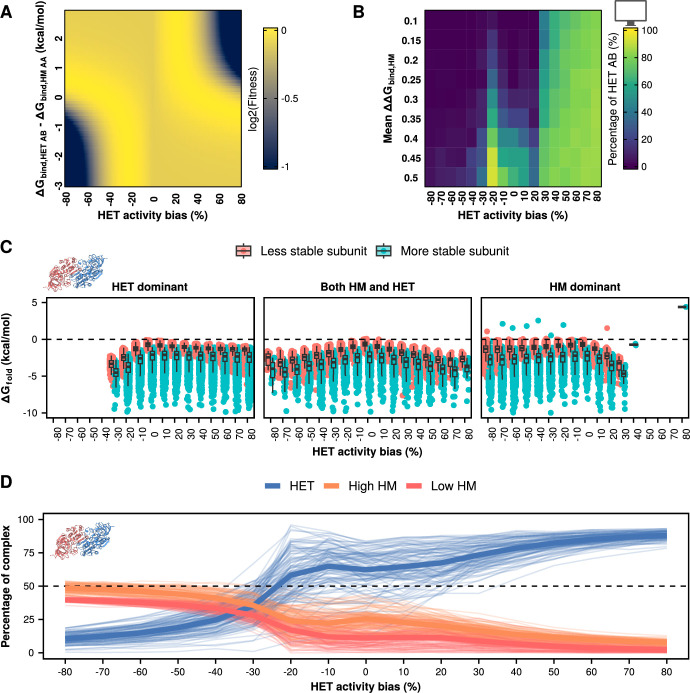
Figure EV5. Simulations with differences in specific activity and lower optimal total activity (alpha = 60).
(A) Fitness landscape when the optimal activity is set to 60. ΔΔGbind,AA, and ΔΔGbind,BB remain constant throughout at −10 kcal/mol. (B) Percentages of heterodimers at the end of parametric simulations with different values of specific activity and varying mean effects of mutations on homodimers. (C) ΔGfold values at the end of simulations with alpha = 60 and different specific activities for homo- and heterodimers. Disfavored outcomes, such as HET dominant when the heterodimer is less active, can still be reached if the subunits remain stable. Boxplots in (C) indicate the median (center lines) and interquartile range (hinges). Whiskers extend from the hinges of each box to the most extreme values that are at most 1.5 times the interquartile range away from the hinges. (D) Percentages of heterodimers and each of the two homodimers for each of the 104 tested structures when simulations consider different specific activities of homo- and heterodimers. The two homodimers were distinguished based on their abundance.

