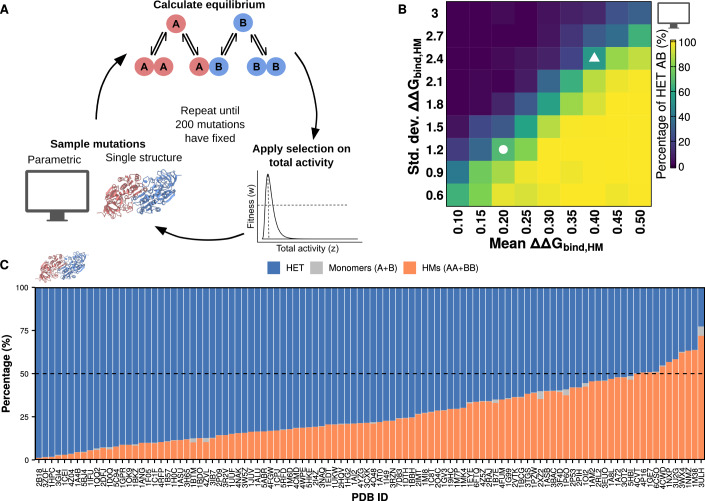
Figure 2. Biases in the distribution of effects on mutations on binding affinity can drive enrichments of homomers or heteromers.
(A) Overview of the simulation workflow. Homodimers from the PDB were used to infer distributions of mutational effects for two regimes of simulations: those with distributions based on the pooled data (parametric) and those using data for a single structure. Mutations are sampled from these distributions, after which the concentrations of dimers and monomers at equilibrium are recalculated. Selection is applied based on the total activity in the system. Simulations continued until 200 mutations were fixed. The structure for 1A72, used as the cartoon for the single structure simulations, was visualized with ChimeraX (Pettersen et al, 2021). (B) Percentage of heteromers at the end of the simulations with each set of parameters for the homodimers (average of 50 replicates, 200 mutations fixed for each). The white circle indicates the condition in which ΔΔGbind,HET and ΔΔGbind,HM are equally distributed (N (0.2, 1.2)). The white triangle indicates the condition in which the distribution for ΔΔGbind,HM uses the same parameters calculated when considering all the sampled structures (N(0.4, 2.4)). (C) Average percentages of heterodimers, homodimers, and monomers for each of the PDB structures at the end of the simulations. The dashed line indicates the starting point at 50% heterodimers and 50% homodimers (25% of each homodimer).

