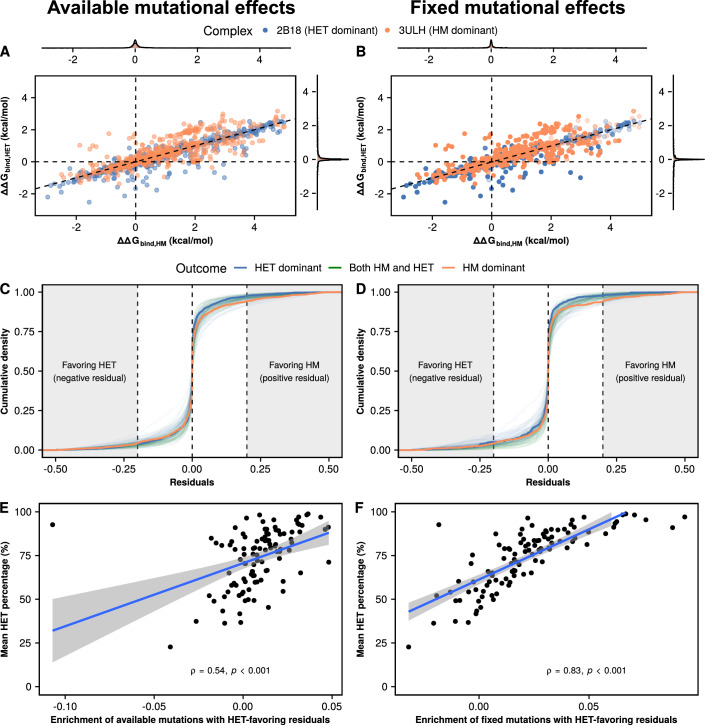
Figure 3. Slight deviations from the diagonal (residuals) are associated with the outcome of the simulations.
(A, B) Distributions of available (A) and fixed (B) mutational effects on ΔGbind,HET and ΔGbind,HM for the two proteins with the most extreme outcomes in Fig. 2C: 2B18 (heterodimer-dominant) and 3ULH (homodimer-dominant). The diagonal (ΔΔGbind,HET = 0.5 * ΔΔGbind,HM) is shown to illustrate the expectation of mutations on the heterodimer having half of the effect of mutations on the homodimer. (C, D) Distributions of available (C) and fixed (D) residuals with respect to the expectation for each of the 104 structures. Colors indicate mean outcomes for each structure: HET dominant (heterodimer >70% of dimers), HM dominant (homodimer >70% of dimers), both HM and HET (rest of cases). The thicker blue and orange lines represent 2B18 and 3ULH, respectively. Shaded regions on the left and right indicate mutations whose residuals have a magnitude of at least 0.2 kcal/mol favoring either the heterodimer (negative values) or the homodimer (positive values). (E, F) Correlation between enrichment of available (E) and fixed (F) mutations with residuals favoring the heterodimer and the mean percentage of heterodimers at the end of the simulations. The enrichment of heterodimer-favoring residuals is calculated as the density of mutations with residuals smaller than −0.2 kcal/mol minus the density of mutations with residuals greater than 0.2 kcal/mol. P values for (E, F) are calculated using the asymptotic t approximation method for Spearman correlation coefficients.

