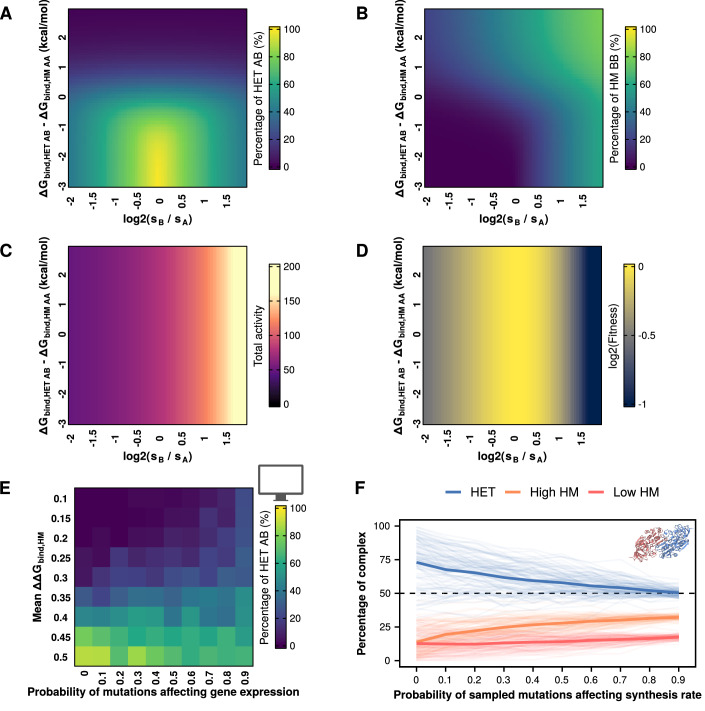
Figure 4. Allowing changes in synthesis rates can limit the bias toward heterodimers.
(A–D) Percentage of heterodimers (A), one of the homodimers (B), total activity (C), and fitness (D) as a function of the ratio of synthesis rates and differences between ΔΔGbind,AB and ΔΔGbind,AA. (A–D) sA, ΔΔGbind,AA, and ΔΔGbind,BB remain constant throughout. Changes in the y-axis indicate changes in ΔΔGbind,AB, with all three values (ΔΔGbind,AA, ΔΔGbind,AB, ΔΔGbind,BB) being identical at zero. (E) Percentages of heterodimers at the end of parametric simulations allowing changes in synthesis rates and varying mean effects of mutations on homodimers. (F) Percentages of heterodimers and each of the two homodimers for each of the 104 tested structures when simulations include different probabilities of mutations affecting synthesis rates. The two homodimers were distinguished based on their abundance, such that high HM refers to the one with the higher concentration and low HM to the one with a lower concentration.

