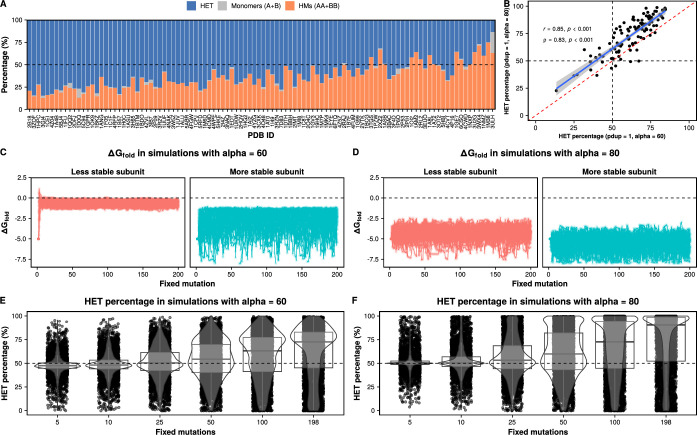
Figure EV2. The general bias observed for heterodimers is also observed when the optimal activity is set to a slightly lower value (alpha = 60).
(A) Percentage of heterodimers, homomers, and monomers at the end of simulations with distributions of mutational effects structures when the optimal activity (alpha) is set to 60. Structures are listed in the same order as in Fig. 2C. (B) Correlation between the percentages of heterodimers observed at the end of simulations with alpha = 60 (data from Fig. S6A) and simulations with alpha = 80 (data from Fig. 2C). The P value for the Spearman correlation coefficient in panel B is calculated using the asymptotic t approximation method. The P value for the Pearson correlation coefficient is calculated using an asymptotic confidence interval based on Fisher’s Z transform. (C, D) Evolution of ΔGfold values in simulations with alpha = 60 (C) and alpha = 80 (D). For simplicity, only the data for PDB: 1GPR are shown. (E, F) Evolution of the percentage of heteromers in simulations with alpha = 60 (E) and alpha = 80 (F). Replicates for all simulations with all structures are shown. Boxplots in (E, F) indicate the median (center lines) and interquartile range (hinges). Whiskers extend from the hinges of each box to the most extreme values that are at most 1.5 times the interquartile range away from the hinges.

