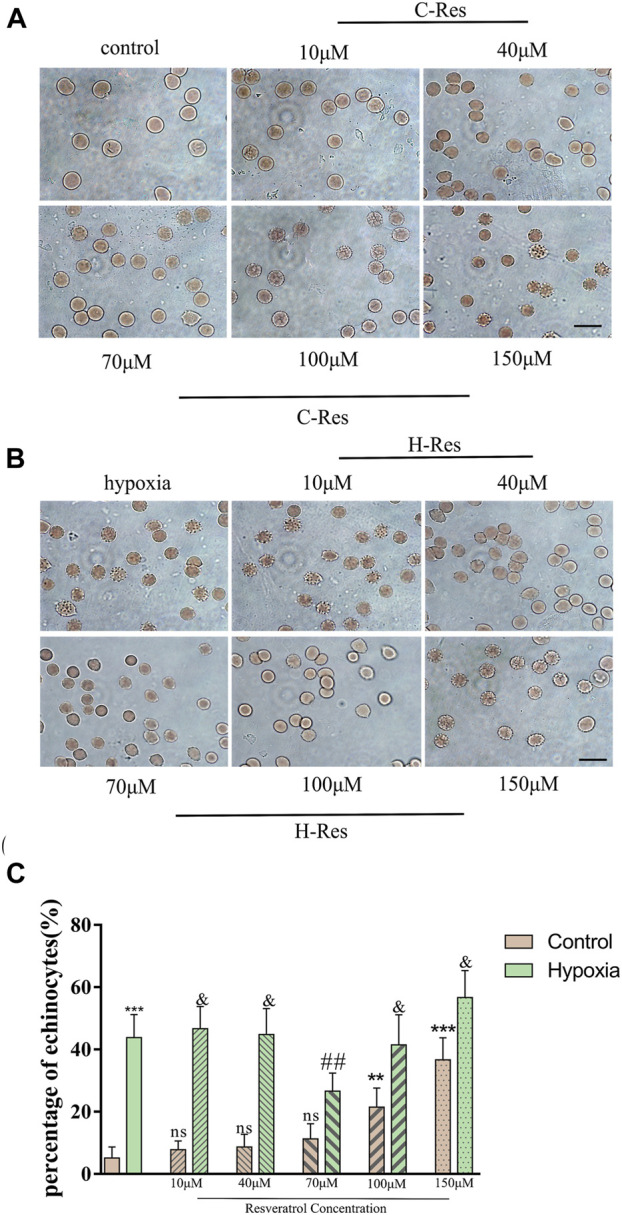
FIGURE 1.

(A), Changes of erythrocyte morphology in different concentrations of resveratrol. (B), Morphological changes of erythrocytes after different concentrations of resveratrol were incubated and treated with hypoxia. Scale bar = 10 μm. (C), Percentage of echinocytes. n = 3, compared with the control group, **p < 0.01, ***p < 0.001, ns means not significant; compared with hypoxia group ##p < 0.01, & means not significant.
