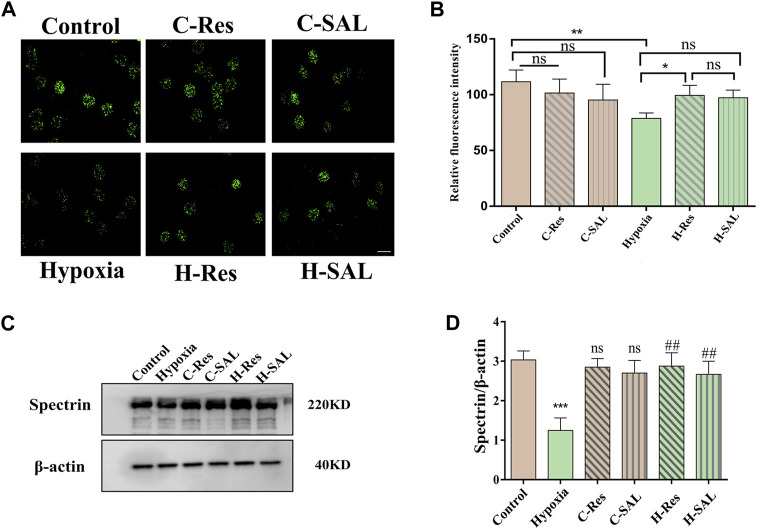
FIGURE 5.
(A) Immunofluorescence staining of spectrin protein in different groups was performed and (B) the fluorescence intensity was analyzed, scale bar = 10 μm. (C) Western blotting was used to analyze the effect of resveratrol on spectrin protein after hypoxic stress in the absence of DTT. (D) Spectrin western blot density was quantified, and β-actin was used as an internal reference. n = 3. Compared with the control group, ***p < 0.001, ns means no significant difference. Compared with the hypoxia group, ##p < 0.01.

