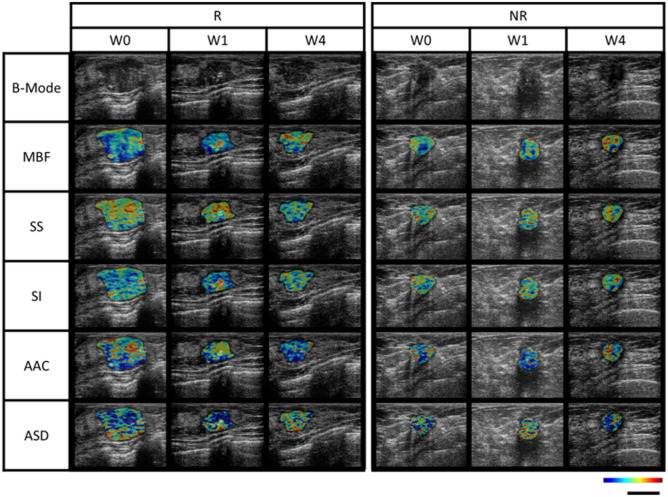
Figure 2.
B-mode imaging and corresponding QUS-parametric maps at different time points (pretreatment or week 0, and week 1 and 4 of neoadjuvant chemotherapy) for 1 patient from responder and non-responder group. MBF range was from -9.6 dB to 34.0 dB, SS range was from -5.7 dB/MHz to 1.6 dB/MHz, SI range from -7.3 dB to 49.0 dB, AAC range was from 20.2 db/cm3 to 81.6 db/cm3, ASD range was from 40 μm to 171 μm. The scale bar represents a length of 2 cm. MBF, mid-band fit; SS, spectral slope; SI, spectral intercept; AAC, average acoustic concentration; ASD, average spectral diameter.

