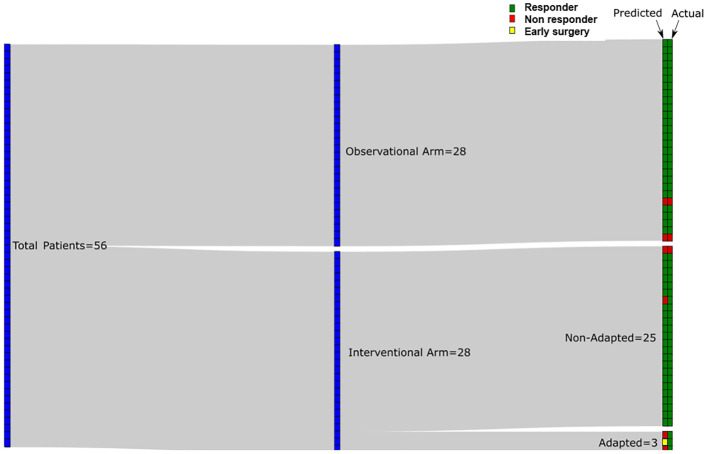
Figure 3.
Sankey diagram for predicted response at week 4 using QUS-radiomics model with the final response on an individual patient basis. Red tiles indicate non-response (predicted or actual) and green tiles indicate response (predicted or actual). In the experimental arm 25/28 patients were not adapted based on information provided to their oncologist whereas 3/28 were adapted. Patient with early surgery is indicated with a yellow tile.

