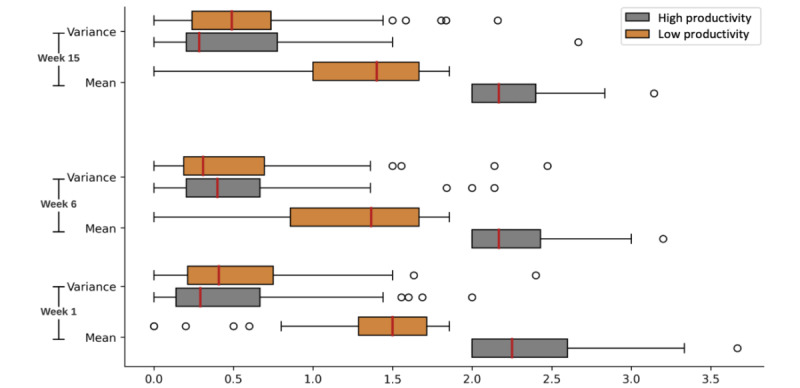
Figure 1.

If the mean of 1 week’s daily productivity is above 2 (SD 0.21), the week will be labeled high productivity; otherwise, the week will be labeled low productivity. Gray represents the mean and variance that come from weeks with high productivity, and orange represents the mean and variance that come from weeks with low productivity. The medians of variance are all less than 0.5, and the 75 percentiles are within 1 no matter what productivity the weeks have. The difference in productivity scores between the 2 adjacent options in the productivity survey is 1, so the low variance indicates that most participants will keep the same productivity level during the whole week. The medians of the mean of both high and low productivity are very close, but there are more small mean values in week 6 for low productivity and more large mean values in week 1 for high productivity.
