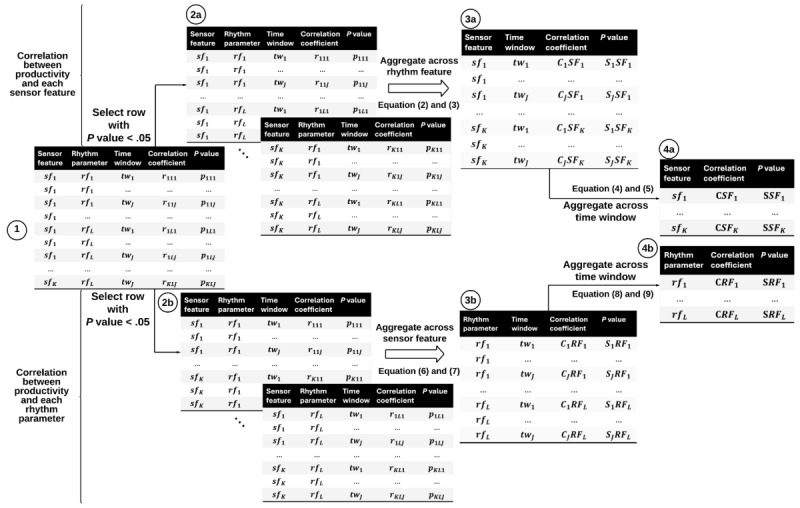
Figure 3.

The pipeline to aggregate the correlation for a multidimensional dataset with K sensor features, L rhythm parameters, and J time windows. The pipeline can output the correlation between productivity and a single sensor, and the correlation between productivity and a single rhythm parameter. In step 1, we got a correlation coefficient and a P value for each behavior, rhythm setting, and week. In step 2, we calculated how rhythms changed related to productivity for each behavior sensor weekly (2a) and for each rhythm setting weekly (2b). In step 3, we combined the correlation and importance scores from all 3 weeks. Finally, in step 4, we converted the correlation and importance values into 1 final score for each sensor behavior (4a) and each rhythm setting (4b).
