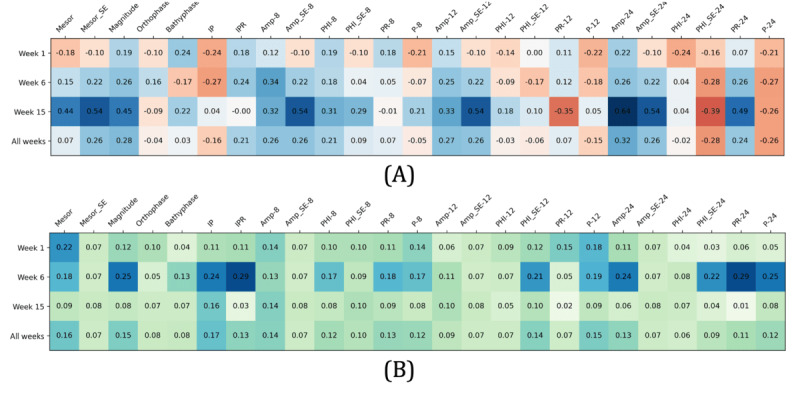
Figure 4.

The heat map displays correlations between rhythm parameters and productivity by week. (A) Average correlation coefficients (C-RF) by week (Week-C); (B) Average significance score (S-RF) by week (Week-S). AMP: amplitude; C: correlation coefficients; IP: integrated P value; IPR: integrated percent rhythm; MESOR: Midline Statistic of Rhythm; P: P value; PHI: acrophase; PR: percent rhythm; RF: random forest; S: significance score.
