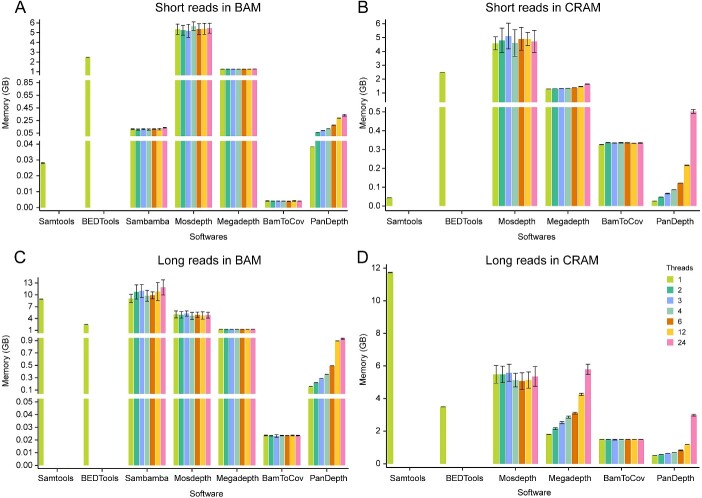
Figure 3.
The memory consumption comparison of seven software tools using 150 GB sequencing data in different numbers of threads for genome coverage calculations. (A) BAM file with short reads as input. (B) CRAM file with short reads as input. (C) BAM file with long reads as input. (D) CRAM file with long reads as input. The X-axis represents the software tools, and the Y-axis represents memory consumption size. The colored bars represent 1, 2, 3, 4, 6, 12 and 24 threads, respectively. Error bars indicate standard deviation (n = 10).

