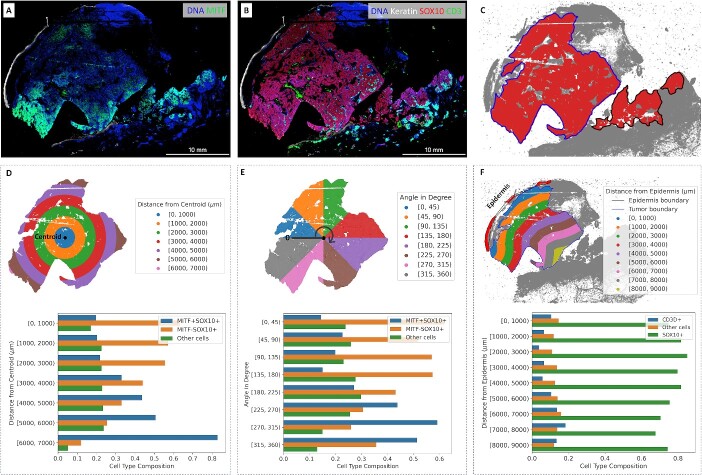
Figure 3.
Cell composition in regions of interest. (A) Gradient of MITF on CyCIF imaging data. (B) Keratin, SOX10 and CD3D expressions on CyCIF imaging data. (C) Boundary of the main tumor area. (D) Cell type composition in subregions based on distance from the centroid. (E) Cell type composition in subregions based on the angle from the zero-degree reference. (F) Cell type composition in subregions based on distance from the epidermis.

