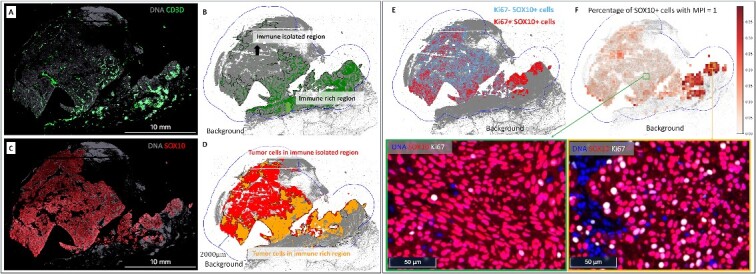
Figure 4.

Tumor isolation index (A–D) and tumor MPI (E, F). (A) Expression level of CD3D+ cells in the MEL1 sample. (B) Division of the overall ROI into two subregions based on CD3D+ cells: (1) immune-isolated region, which has almost no immune cells; (2) immune-rich region. (C) Expression level of tumor (SOX10+) cells in the MEL1 sample. (D) Visualization of tumor cells in the immune-isolated region and immune-rich region, respectively. The tumor isolation index for this sample is 46.9%, which quantifies the percentage of tumor cells in the immune-isolated region. (E) Display of Ki67+ and Ki67− tumor cells. Ki67 is a proliferative marker. The overall percentage of proliferative tumor cells (MPI = 1) in the MEL1 sample is 7.4%. (F) Percentage of tumor cells with MPI = 1 in subregions and the zoomed-in CyCIF images. A sliding window of 300  300 microns is applied over the ROI to compute the percentage of tumor cells with MPI = 1. In this example, the MPI is computed using Ki67 due to the availability of markers. Additionally, zoomed-in CyCIF images are provided to visualize areas with varying levels of Ki67+ tumor cells.
