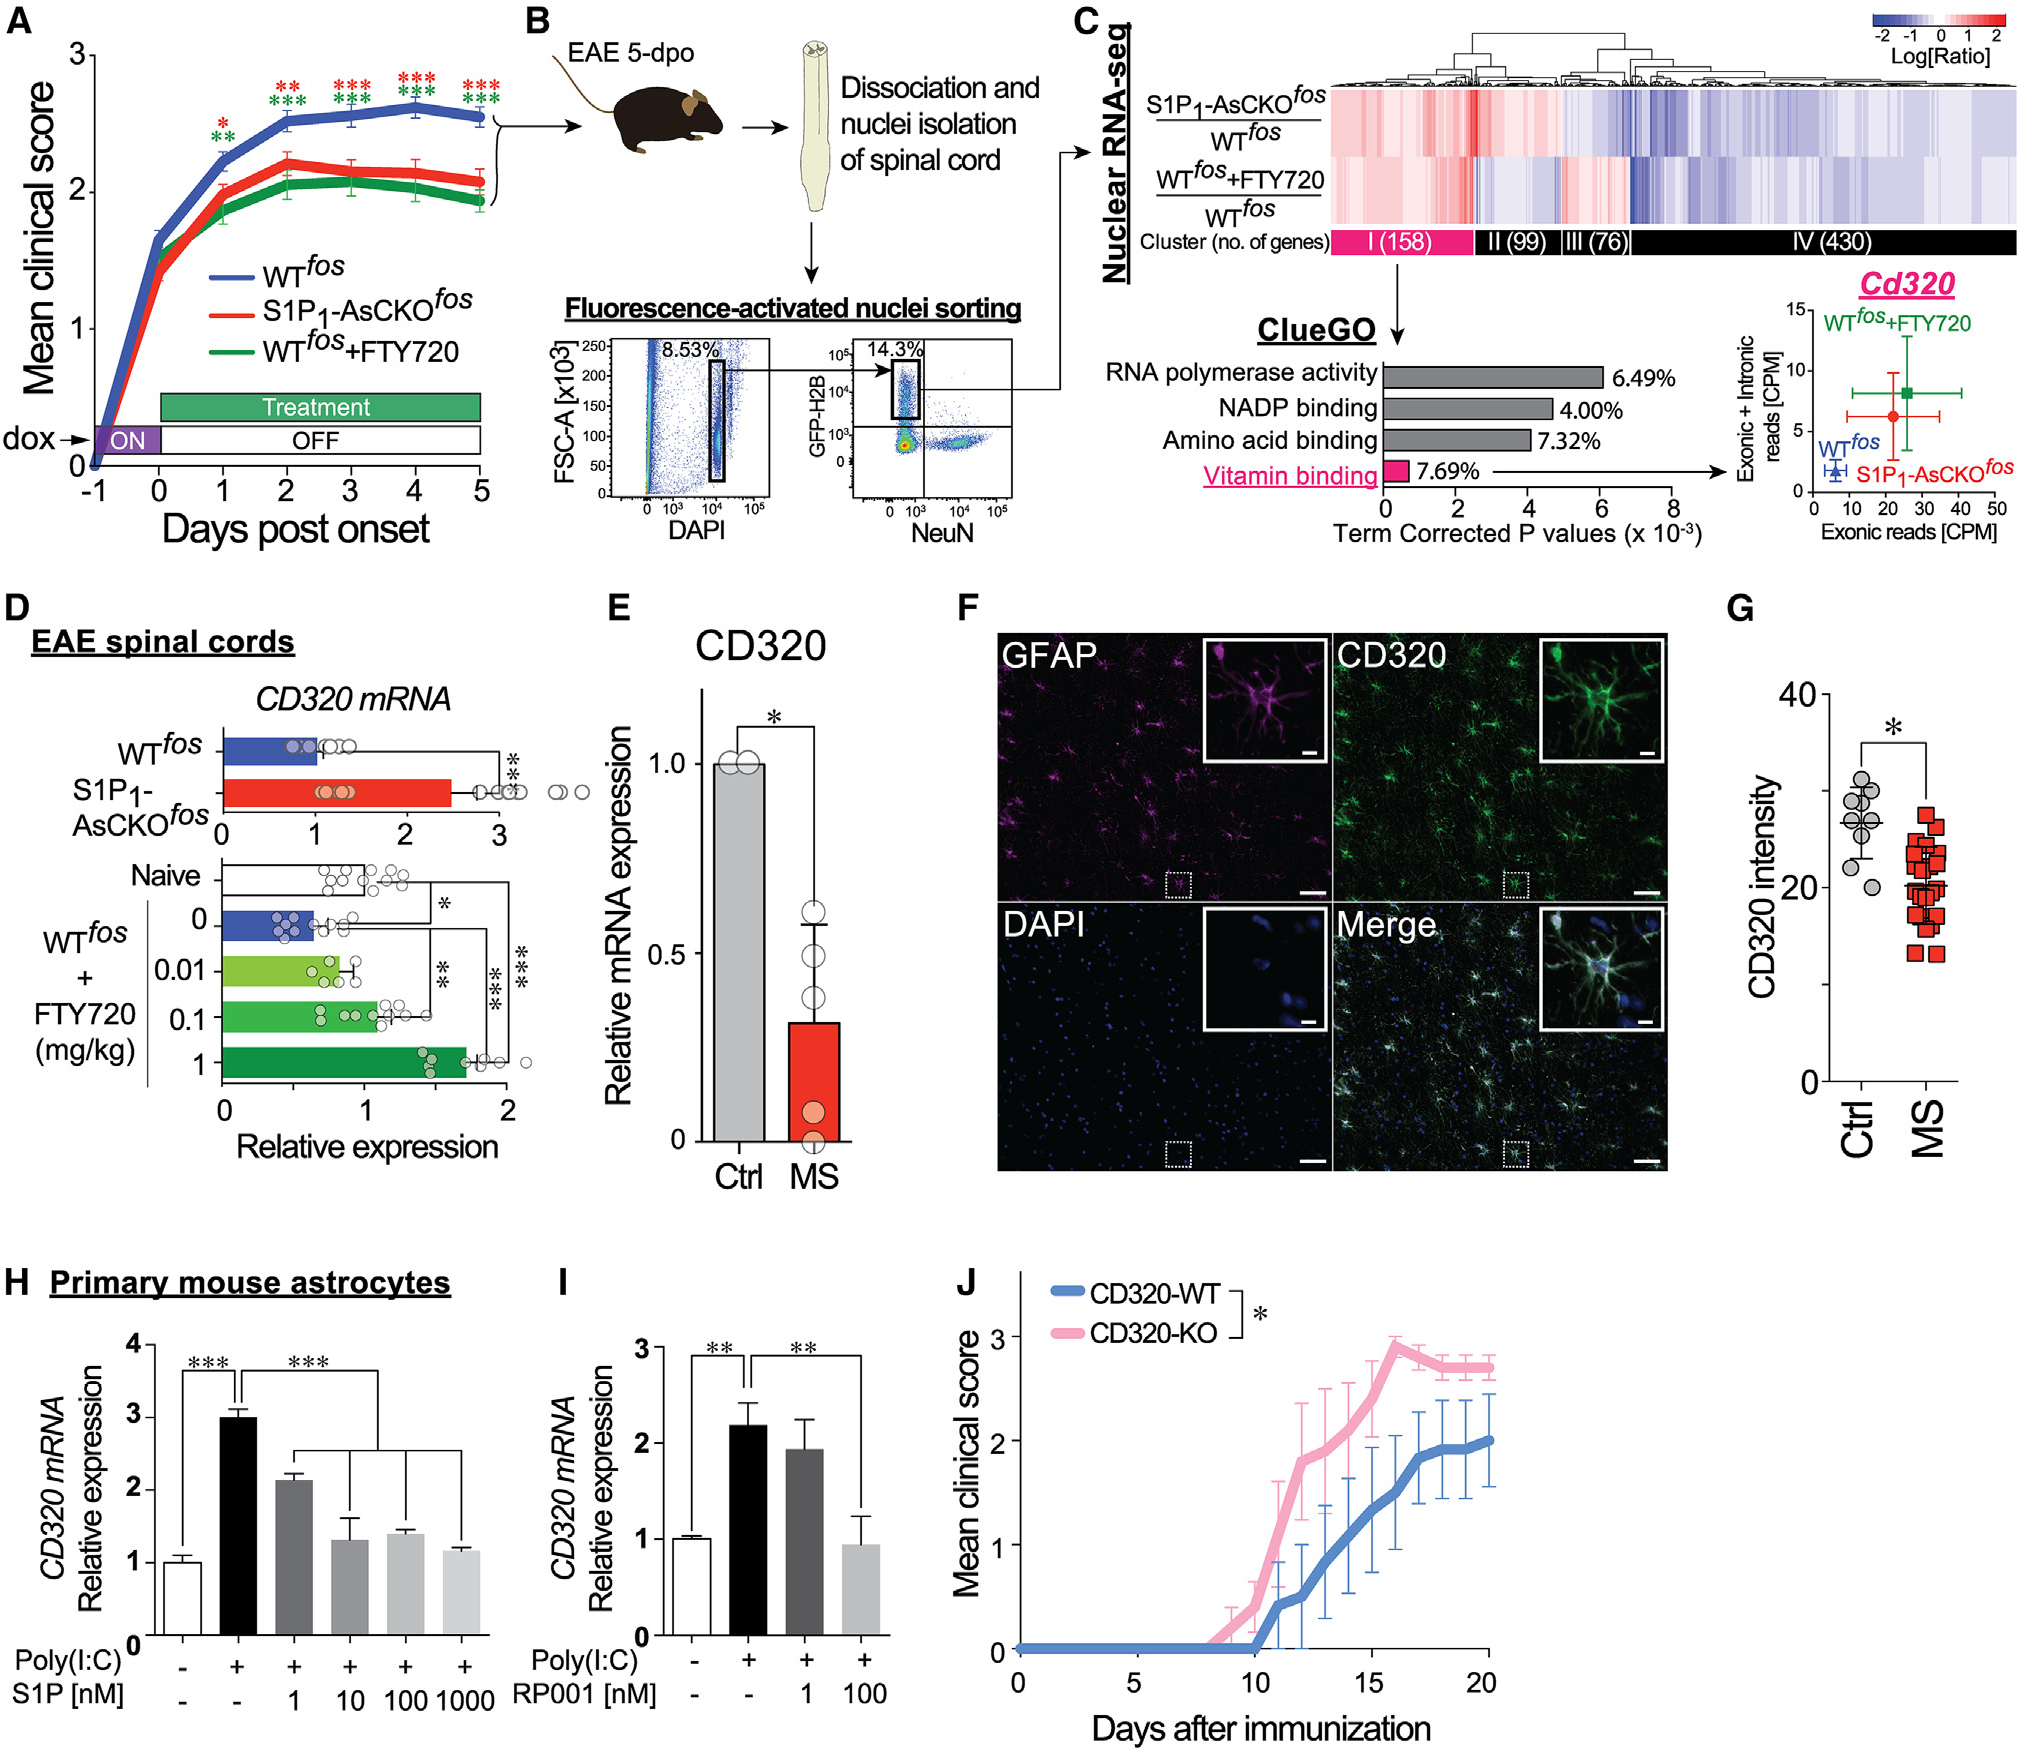
Figure 1. FTY720 restores CD320 expression that is downregulated in EAE and MS lesions and is essential for protecting against neuroinflammation.

(A) Disease course of EAE-induced WTfos, S1P1-AsCKOfos, and FTY720-treated WTfos (WTfos+FTY720) mice (n = 50, 43, and 32 animals, respectively). Day 0 was designated as the day of clinical sign onset (mean ± SEM, *p < 0.05, **p < 0.01, and ***p < 0.001 by two-way ANOVA with Bonferroni’s multiple comparisons test). The x axis represents “days post-onset,” which is different from “days after immunization.”
(B) Fluorescence-activated nuclei sorting (FANS) to isolate NeuN−GFP+ singlet nuclei from EAE SCs at 5 days post-onset, which is equivalent to 5 days off doxycycline.
(C) Nuclear RNA-seq. Heatmap displays 2-fold up- and downregulated genes in S1P1-AsCKOfos and WTfos+FTY720 vs. WTfos. Top 4 significantly enriched gene ontologies in cluster I are identified by ClueGO38 of Cytoscape.39 Expression levels of Cd320 (count per million [CPM]) are plotted (mean ± SEM).
(D) Expression of Cd320 mRNA in EAE SCs determined by qPCR (mean ± SEM, *p < 0.05, **p < 0.01, and ***p < 0.001 by t test [top] and by one-way ANOVA with Tukey’s multiple comparisons test [bottom]).
(E) Cd320 mRNA expression in human MS normalized to control brains (mean ± SEM, n = 5 and 2 brains, respectively; *p < 0.01 by one-sample t test).
(F) Immunohistochemistry (IHC) for CD320 and GFAP in human control brain. Scale bars, 100 μm and 5 μm (inset).
(G) CD320 immunolabeling is significantly reduced in human MS plaques as compared to control brain. Each symbol represents an assessed region of interest in the sections. *p < 0.001 by Mann-Whitney U test.
(H and I) Cd320 mRNA expression in primary astrocytes stimulated with 10 μg/mL poly(I:C) for 24 h in the presence of S1P (H) or the S1P1-specific agonist RP001
(I). Data are from three independent experiments of three technical replicates (mean ± SEM, **p < 0.01 and ***p < 0.001 by one-way ANOVA with Tukey’s multiple comparisons test).
(J) EAE disease course of CD320-WT and CD320-KO mice (n = 6 and 5 animals, respectively). Data are from three independent experiments (mean ± SEM, *, statistical significance was analyzed by two-way ANOVA; interaction, p = 0.90; time, p < 0.0001; genotype, p < 0.001).
