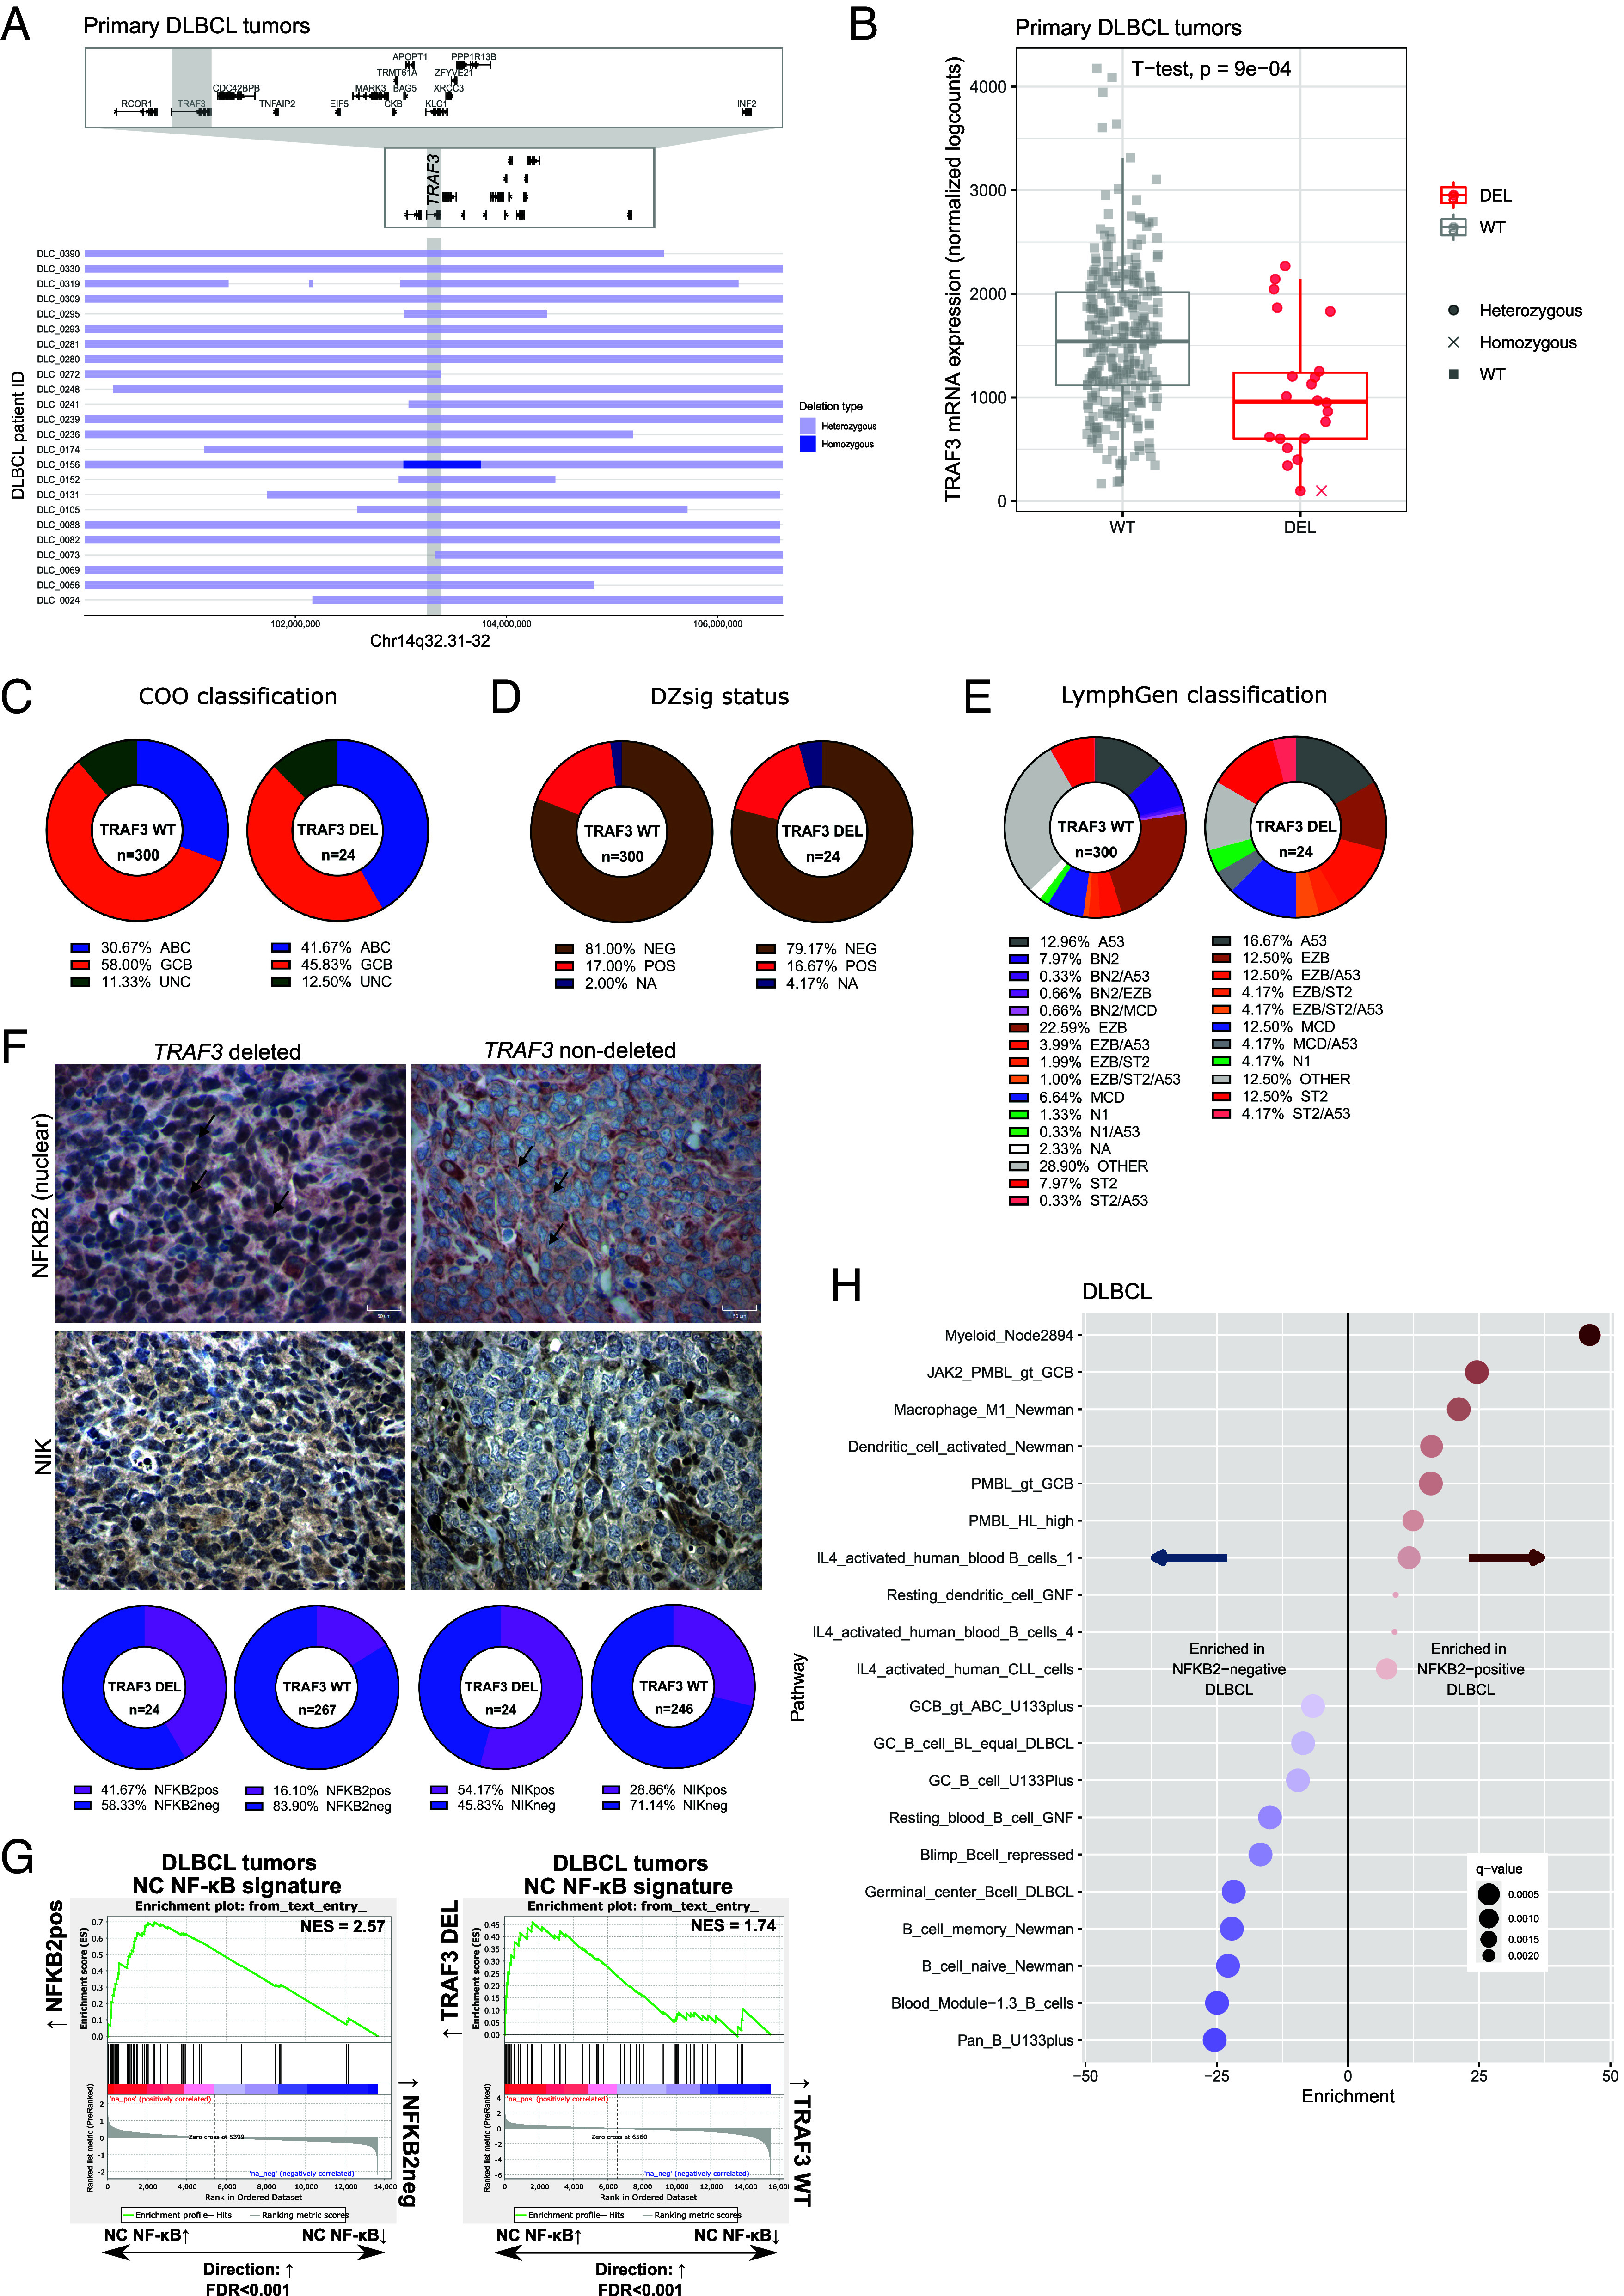
Fig. 1.

Genetic characterization of TRAF3 deletions in DLBCL. (A) Horizontal bars correspond to focal copy number loss along chromosome 14q32.31-32 (n = 24) centered on the TRAF3 gene (gray vertical bar). Light blue represents hemizygous deleted regions, and dark blue represents homozygous deleted regions in each case. Individual gene bodies and exons in the visualized region are depicted above including a zoomed view. (B) Copy number-to-mRNA expression correlation plot on 313 DLBCL tumors. Box-and-whisker plot shows the median centered around the upper and lower quartiles with each dot representing an individual patient sample. (C–E) Pie graphs illustrating the proportion of subtypes within TRAF3 WT or DEL cases according to the following classification algorithms: COO (C), DZsig (D), and LymphGen (E). (F) Representative IHC images for NFKB2 and NIK stained DLBCL samples. Magnification at 40×, and a 50 μm scale is provided. In the upper images, the black arrows indicate the nuclear compartment of tumor cells stained with NFKB2. The number of stained samples is provided in SI Appendix, Table S6. (G) GSEA using the NC NF-κB expression signature in NFKB2pos vs. NFKB2neg tumors (Left) and TRAF3-deleted vs. TRAF3 WT tumors (Right). (H) Top pathways from LymphoChip enriched in NFKB2pos (Right) or NFKB2neg cases (Left) in the DLBCL cohort. Red and blue color gradients indicate the fold enrichment of pathways.
